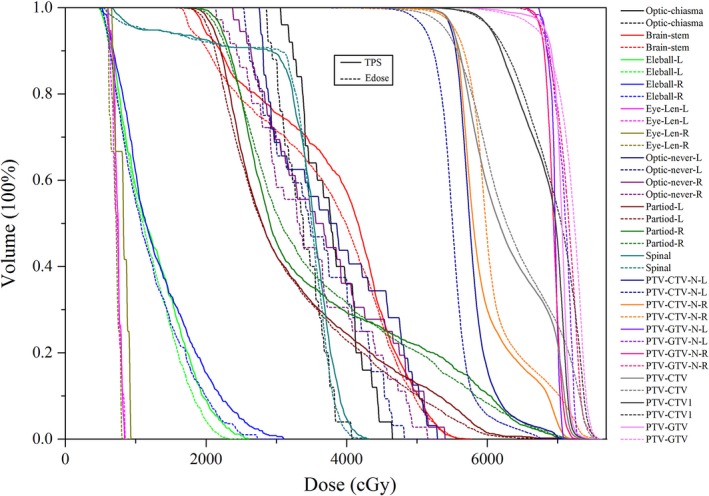
Figure 4.

DVH comparisons of PTVs and OARs between Edose and TPS for one of the NPC patients. The solid lines represent the results of the TPS calculations, whereas the dotted lines represent the results of the Edose reconstruction. GTV: gross tumor volume; CTV: clinical target volume; CTV1: lymph nodes with a high risk of occult metastases; GTV‐N‐L: left GTV of neck lymph nodes; GTV‐N‐R: right GTV of neck lymph nodes; CTV‐N‐L: left of lymph nodes with low risk of occult metastases; CTV‐N‐R: right of lymph nodes with low risk of occult metastases. The PTV‐GTV, PTV‐GTV‐N‐L, PTV‐GTV‐N‐R, PTV‐CTV, PTV‐CTV1, PTV‐CTV‐N‐L, and PTV‐CTV‐L‐R were created by adding 5 mm to the margins of GTV, GTV‐N‐L, GTV‐N‐R, CTV, CTV1, CTV‐N‐L and CTV‐L‐R, respectively.
