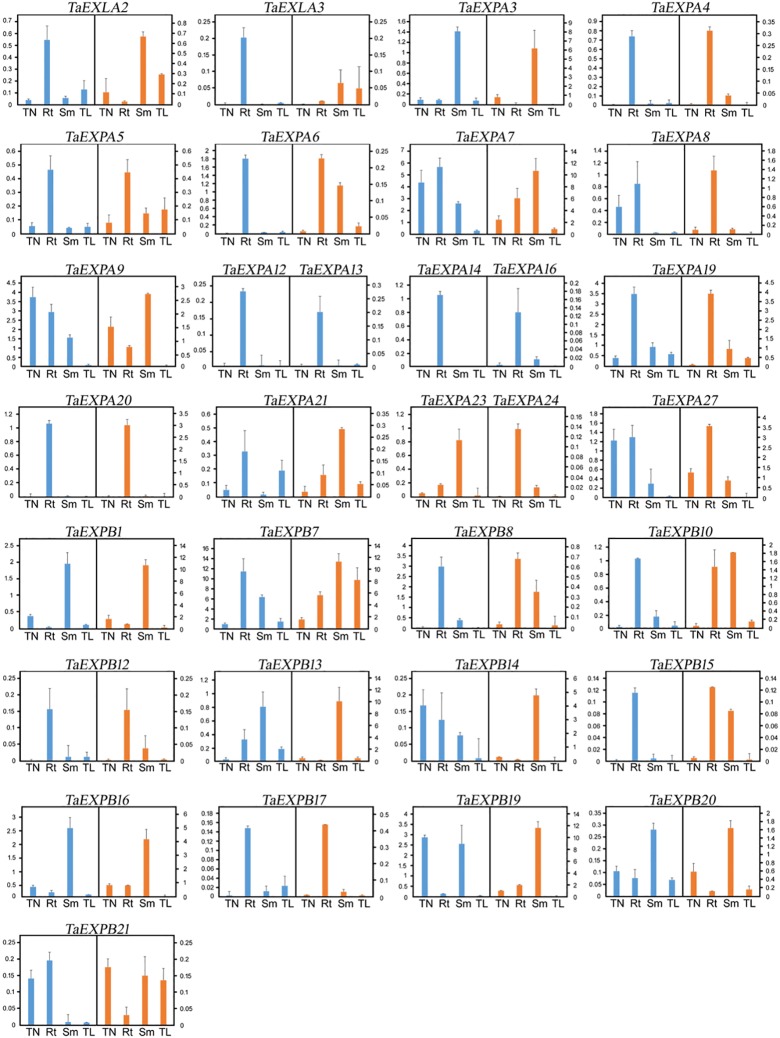
Fig 5. RT-qPCR of wheat expansin expressions in CS (blue) and D1 (orange) during the three leaf stage under normal growth condition.
Note that certain genes (such as TaEXPA12 and TaEXPA13) were only shown their expression in CS (blue) and certain other genes (such as TaEXPA23 and TaEXPA24) were only shown their expression in D1 (orange). It indicates that the expression of these genes was only detected in cultivar, but not the other.

