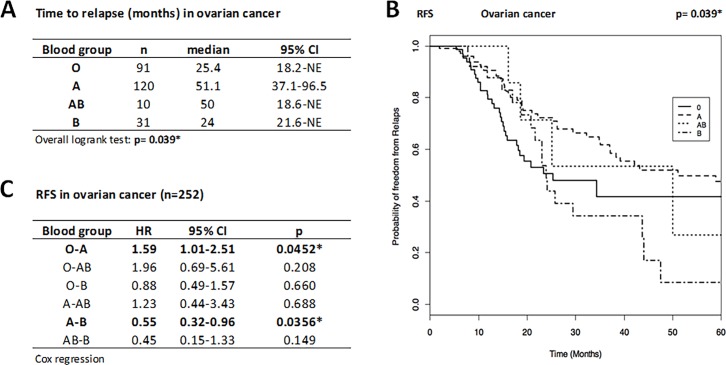
Fig 1.
Time to relapse (A), Kaplan-Meier curve for RFS (B), and HR for disease recurrence (C) in ovarian cancer patients (n = 252). BG O and B patients showed a significantly increased risk for relapse compared to A patients (59%, p = 0.045 and 82%, p = 0.036, respectively; Cox regression). Hence, BG A patients have better prognosis with a significant longer RFS than those with O and B. Time to relapse presented as median (months) and 95%CI and compared by overall logrank test and disease recurrence risk presented as HR and 95%CI. Statistical significance marked by asterisks (*) or highlighted. NE, not estimable. RFS given as probability of freedom from relapse as a function of time (months).

