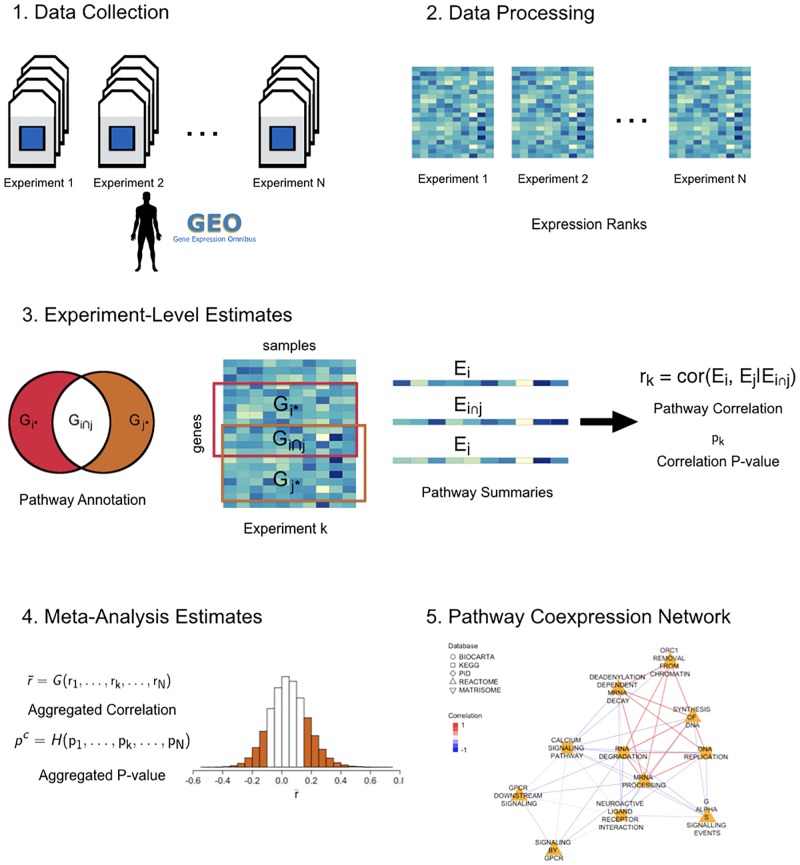
Fig 1. Pathway Coexpression Network (PCxN) overview.
(1) Human gene expression arrays for normal human tissues curated from GEO in Barcode 3.0 (2) The gene expression levels were replaced by their ranks so all arrays share a common scale. (3) For each microarray experiment, we first estimated the pathway expression based on the mean of the expression ranks, then the pathway correlation adjusted for shared genes, and tested the significance of the correlation. (4) We aggregated the experiment-level estimates to get the global pathway correlation and its corresponding significance. (5) We built a pathway coexpression network based on the significant pathway correlations.

