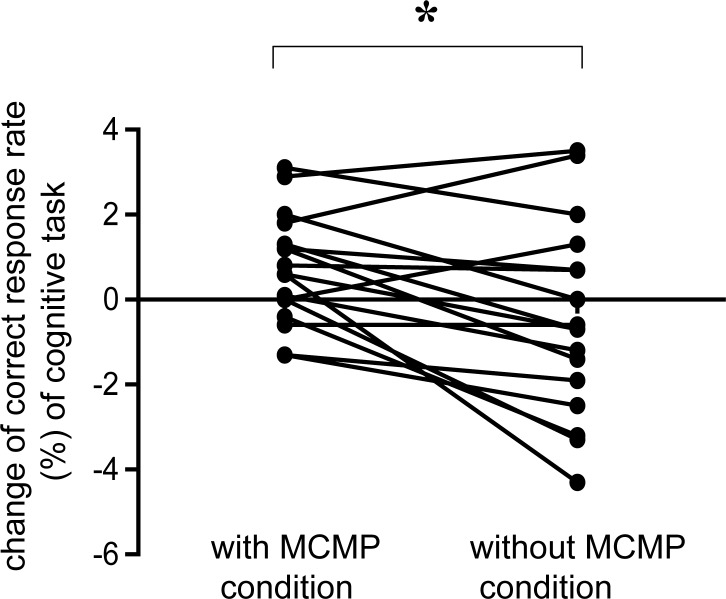
Fig 6. Change of correct response rate (%) in the cognitive task.
Left dots indicate the correct response rate in the MCMP condition, and right dots indicate the correction rate in the without-MCMP condition. Changes in correct response rate were found in Task B for non-Stroop trials before and after the fatigue-inducing task. Data are presented as mean and SE. *p < 0.05, significant difference (paired t-test with Bonferroni correction).

