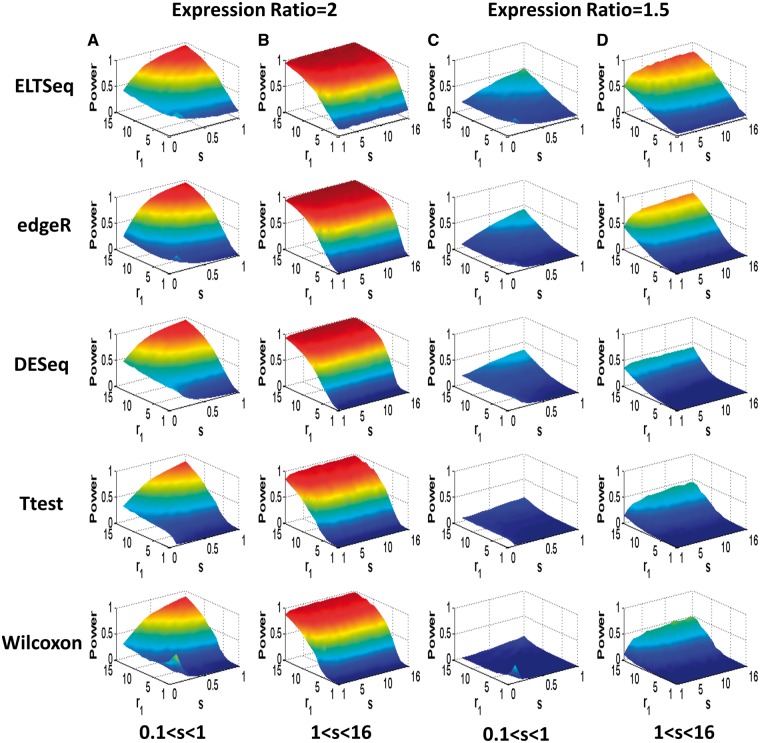
Figure 2.
Average power for different methods in simulations. (A) The expression ratio is 2 and the scale ratio s is between 0.1 and 1. (B) The expression ratio is 2 and s is between 1 and 16. (C) The expression ratio is 1.5 and s is between 0.1 and 1. (D) The expression ratio is 1.5 and s is between 1 and 16. For each pair of chosen parameters, simulation was run for 100 times to obtain the average power of true DE gene identification with a FDR of 0.05. The parameter p1 for Group 1 was randomly sampled from real data estimates.

