Figure 4.
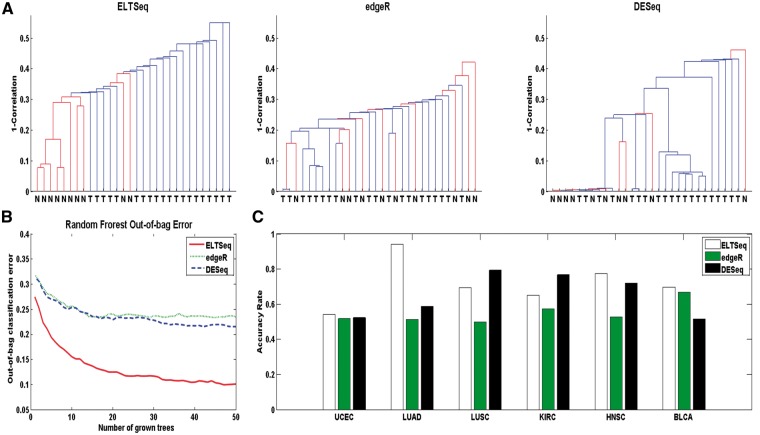
Performance of different methods for biomarker identification. (A) Dendrogram of the prostate tumor and normal tissue samples clustered by top 50 DE genes identified by ELTSeq, edgeR and DEseq, respectively. (B) Out-of-bag classification errors when running the random forest algorithm by growing 50 trees using top 50 DE genes of the prostate cancer data as features. (C) Clustering accuracy rate of the K-means (K=2) clustering for tumor and normal tissue samples in the testing set. Top 100 DE genes identified by each method were used as features, respectively. The classification accuracy rate is defined as the number of correctly classified samples divided by the total number of samples.

