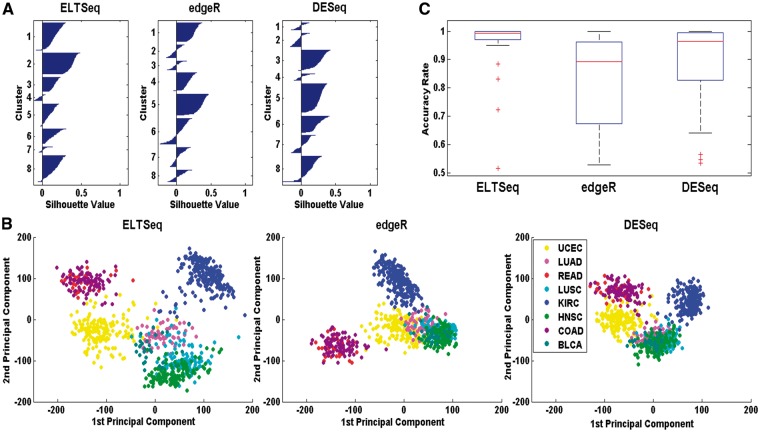
Figure 5.
Performance of different methods for tumor classification. (A) Silhouette plots based on the results of the K-means clustering (K = 8 for eight tumor types). The union of top 20 DE genes across all 28 pairwise comparisons was used as features to cluster the samples in the testing set. (B) Scatter plots of eight different types of tumor samples in the testing set using the first two principal components calculated with the union of top 20 DE genes. (C) Boxplot of pairwise classification accuracy rate of the K-means (K=2) clustering using top 20 DE genes identified by each method.

