
Fig. 4.
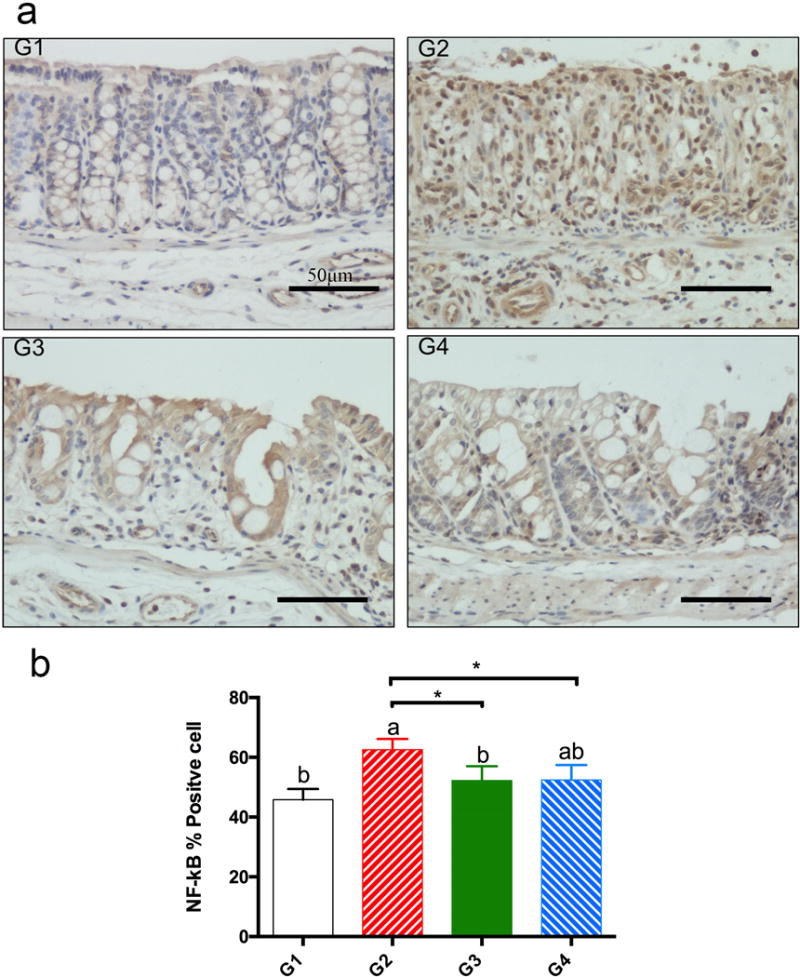
nf-κb p65 immunohistochemical staining (panel a, 400×). panel a: ihc staining of nf-κb p65: g1, normal colonic mucosa from g1 with positive staining in the cytoplasm and low positive staining in the nucleus; g2, colitic colon mucosa from g2 with high positive staining in the nucleus; g3, colitic colon mucosa from g3 with lower positive staining in the nucleus; g4, colitic colon mucosa from g4 with lower positive nf-kb p65 staining in the nucleus. panel b: percentage of nf-κb p65 positively stained cells (mean ± sd, n=5). a, b on top of bars indicating significant difference (p<0.05) by anova, * indicating difference (p<0.05) by t-test.