
Fig. 3.
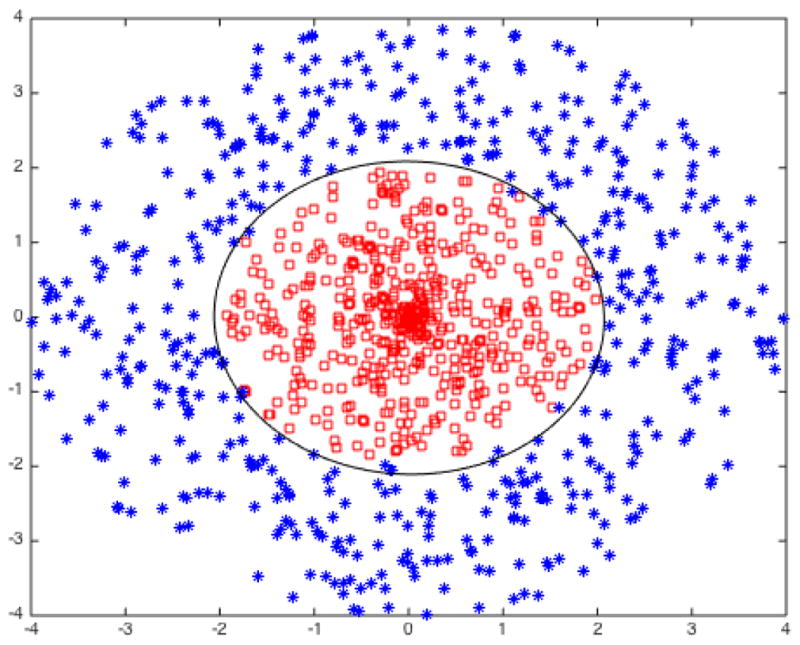
Scatter plot of the simulated data. The two classes of the binary classification task are indicated by the red squares and blue stars. The black oval indicates the decision boundary found using SVM with a quadratic kernel.
Official websites use .gov
A
.gov website belongs to an official
government organization in the United States.
Secure .gov websites use HTTPS
A lock (
) or https:// means you've safely
connected to the .gov website. Share sensitive
information only on official, secure websites.
Scatter plot of the simulated data. The two classes of the binary classification task are indicated by the red squares and blue stars. The black oval indicates the decision boundary found using SVM with a quadratic kernel.