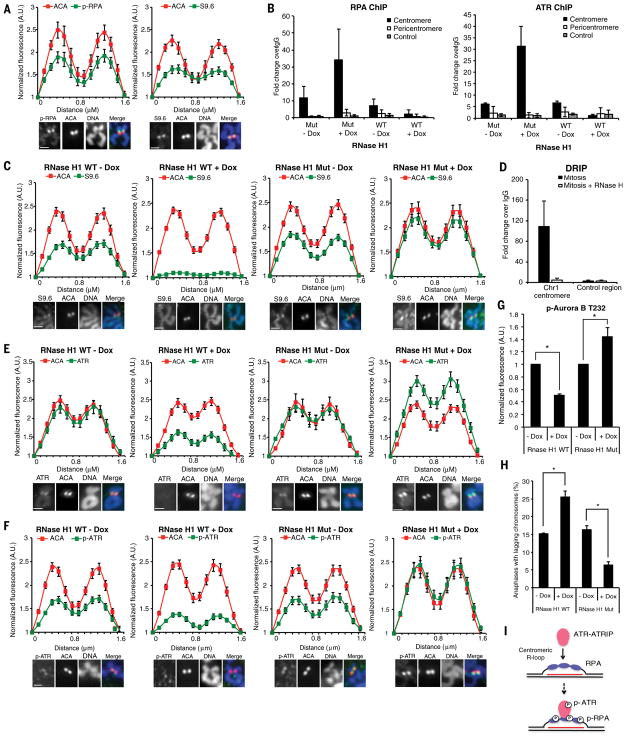
Figure 4. ATR activation at centromeres is driven by R loops.
(A) Line scan analysis (top) and representative images (bottom) of centromeric phospho-RPA32 S33 (p-RPA), S9.6, and ACA in chromosome spreads of RPE1 cells. Scale bar, 2 μm. (B) Quantitative PCR of RPA (right) or ATR (left) ChIP in HeLa-derived RNaseH1 WT/MUT inducible cell lines. Cells were synchronized in G2 with CDK1i, uninduced or induced with Dox for 4 h, and released into mitosis in the presence of nocodazole for 1 h (see Methods). (C,E,F) Line scan analysis (top) and representative images (bottom) of centromeric S9.6 (C), ATR (E), p-ATR (F), and ACA in RNaseH1 WT/MUT inducible cell lines. Cells were treated as in (B). Scale bar, 2 μm. (D) Quantitative PCR of DRIP in mitotic RPE1 cells. (G) Relative fluorescence intensity of p-Aurora B in RNaseH1 WT/MUT inducible cell lines. Cells were treated as in (B). (F) Percentage of anaphase cells with lagging chromosomes. Cells were treated as in (B). Scale bar for all panels, 2μm. Error bars in all panels represent SEM. *P ≤ 0.01, two-tailed t-test. (I) A model in which ATR-ATRIP is recruited to and activated by RPA-coated centromeric R loops in mitosis. The red line depicts centromeric RNA hybridized with DNA.

