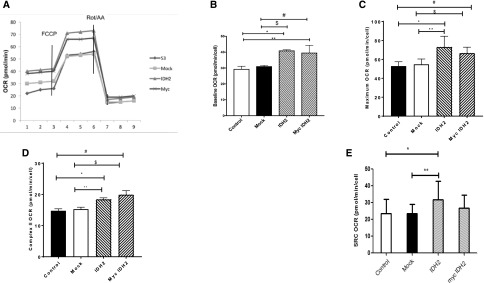
Figure 3.
IDH2 increases cellular respiration in MPTCs. (A) Respiration was analyzed using a Seahorse. Seven micromolar carbonyl cyanide p-trifluoromethoxyphenylhydrazone (FCCP) and 6 μM Rotenone and Antimycin A (Rot/AA) were added to determine (B) baseline, (C) maximal, and (D) complex 2 OCR. (E) Maximal respiration minus baseline respiration was used to calculate SRC (n=9 wells per group). All bar graphs are expressed as mean±SD. *P<0.05, IDH2 versus control; **P<0.05, IDH2 versus mock; #P<0.05, myc Idh2 versus control; $P<0.05, myc Idh2 to mock.

