Figure 5.
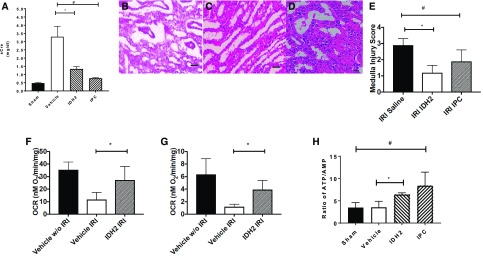
Idh2 mimics IPC. (A) Comparison of serum creatinine (sCr) after IPC or Idh2 delivery 24 hours after IRI (n=5 per group). *P<0.05, Idh2 versus vehicle; #P<0.05, IPC versus vehicle. (B–D) Hematoxylin and eosin–stained section of renal outer medulla after IRI in rats treated with (B) saline, (C) Idh2 injection, or (D) IPC is shown, and corresponding injury scoring is in E. Scale bar, 20 μm. *P<0.05, IRI IDH2 versus IRI saline; #P<0.05, IRI IPC versus IRI saline. Mitochondria respiration 1 hour after IRI in vehicle- or Idh2-treated rats is shown with (F) pyruvate or (G) succinate as a substrate (n=7 per group). *P<0.05, Idh2 IRI versus vehicle IRI. (H) Renal ATP-to-AMP ratios are shown in sham-, vehicle-, Idh2-, and IPC-treated rats (n=3 per group). All bar graphs are expressed as mean±SD. *P<0.05, Idh2 versus vehicle; #P<0.05, IPC versus sham.

