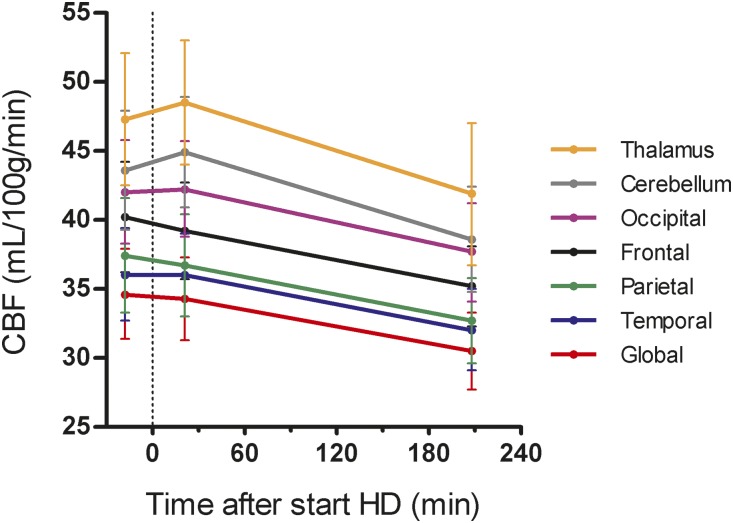
Figure 3.
Global and regional CBF declined during HD. The CBF trajectories are shown with 95% CI's (vertical lines), and were calculated from least squares means according to LMM. Scan 1 was performed at a mean of 18 minutes (range, 15–31 minutes) before the start of HD. HD is regarded as baseline (t=0). Scan 2 and scan 3 were performed at a mean of 21 minutes (range, 13–29 minutes) and 209 minutes (range, 168–223 minutes) after the start of HD, respectively.

