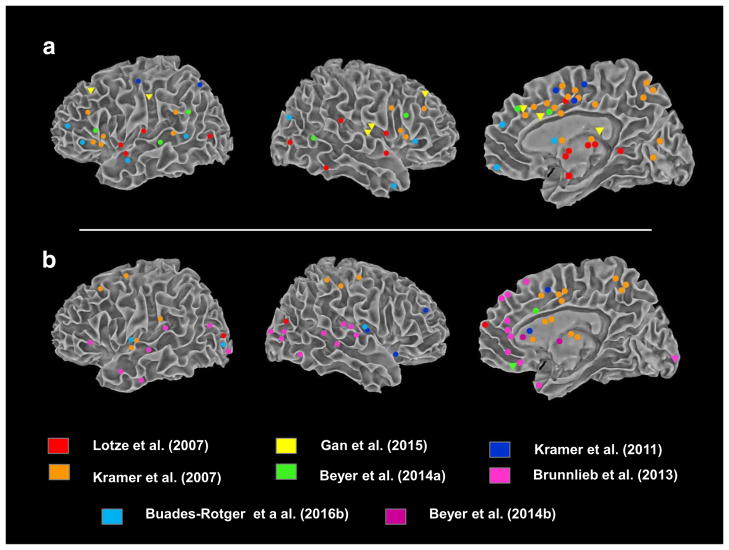
Fig. 2.
Summary of peak activations reported in fMRI studies of the TRT. Activations are plotted in MNI space using authors’ reported coordinates or figures. Activations reported without coordinates (e.g., Lotze (2007)) are presented in Table 1. Cortical activations were projected using SUMA. Results include whole-brain and ROI findings. a Provocation-related activations. Circles = high > low provocation by the opponent. Triangles represent activations to low>high provocation. For Lotze et al., only parametric modulations are presented (see Results and Table 1). In all studies except Lotze (2007) and Gan (2015), provocation effect was analyzed during decision-making. Provocation effects of Buades-Rotges on outcome phase are not displayed (see Table 1 for list). b Retaliation-related activations. Circles = high > low retaliation selections by the participant. In Brunnlieb (2013), results reflect “active” trials (in which a selected punishment would be administered) versus “passive” trials (in which the selected punishment would not be administered). In Kramer (2011), coordinates represent areas whose activity in the provocation phase correlated with behavioral aggression on the task

