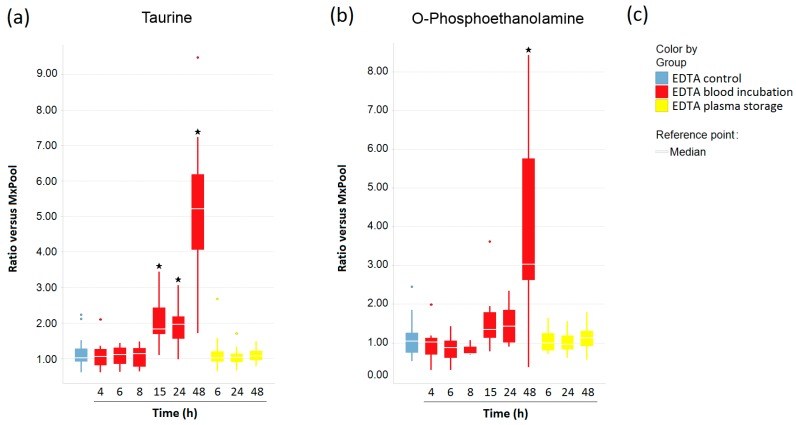
Figure 6.
The impact of pre-analytical variations on (a) taurine and (b) O-phosphoethanolamine concentrations in EDTA blood and plasma, represented by boxplots; In (a,b), stars indicate significant differences compared with the control group, calculated by using ANOVA with a significance level of p < 0.05; (c) Legend for the boxplots in (a,b).

