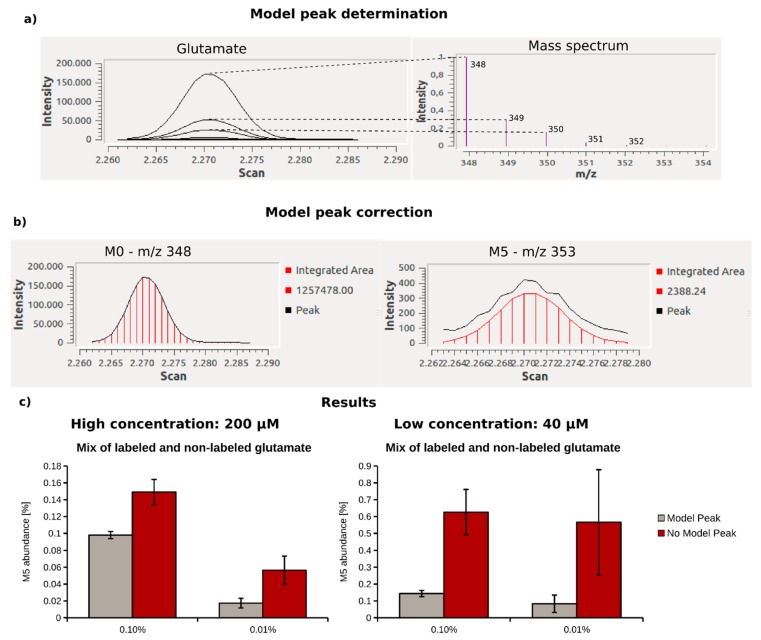
Figure 3.
Model peak correction shown for glutamate using MetaboliteDetector—(a) Gas chromatographic peak and respective mass spectrum of the glutamate MSTFA derivative (Glutamate_3TMS); (b) the peak shape of the monoisotopic peak of glutamate (M0—m/z 348) is of high quality, and therefore used for peak shape correction of the low intensity isotopic peaks, like the 5-times labeled derivative (M5—m/z 353); (c) comparison of the mass isotopomer distributions (MIDs) for 0.10 and 0.01%. 13C-enriched glutamate at high (200 µM) and low (40 µM) concentration, calculated with (gray) and without (red) model peak correction.

