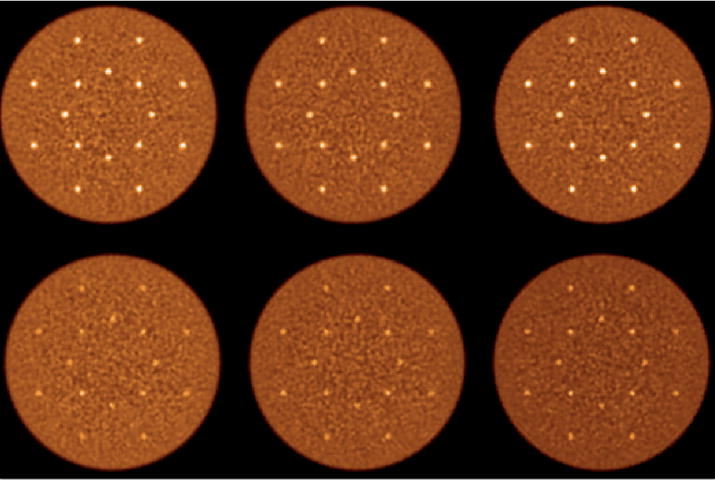
Figure 11.

Reconstructed images of the central transverse slices for the simulated lesion phantoms with 1 cm (top row) and 0.5 cm (bottom row) diameter lesions. Moving left to right in each row are images from Anger, 1st max crystal, and 2nd max crystal positioning algorithms. The water-filled cylinder was 35 cm diameter by 70 cm long and sphere uptake was 3:1 with respect to background. The distribution of 16 spheres in each phantom was at radial distances of 7 and 13 cm. Results are from an EGS4-based simulation and images are shown for iteration number 10 of the fully 3D list-mode TOF OSEM reconstruction algorithm. All images are shown on a common color scale.
