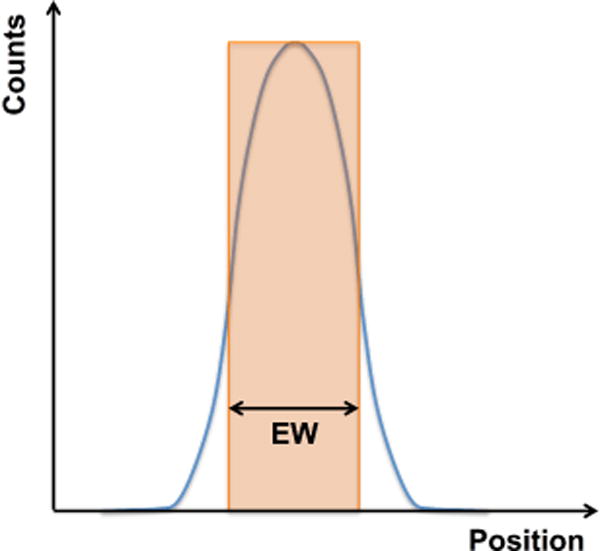
Figure 3.

Schematic showing the spatial profile (blue curve) and the equivalent width (EW). EW is defined as the width of the rectangular region (in orange) that has height equal to the profile maximum, and width such that total counts within the region are the same as the total counts within the spatial profile.
