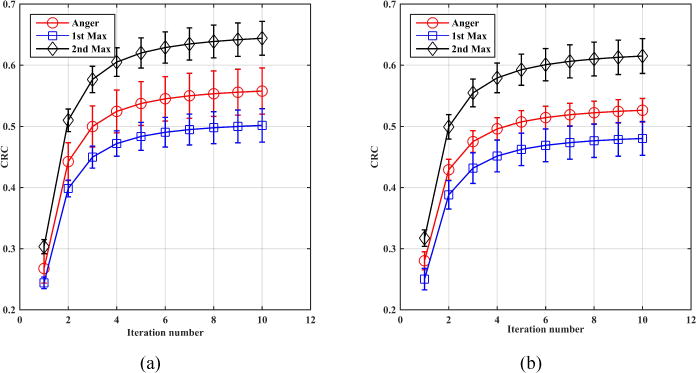
Figure 9.

Contrast recovery coefficient (CRC) for 1 cm diameter spheres as a function of iteration number for spheres at radial position of (a) 7cm and (b) 13 cm. The sphere uptake was 3:1 relative to a background that was a 35 cm diameter by 70 cm long cylinder. Each CRC value is an average over 8 equivalent spheres, while the error bar is the ± standard deviation value calculated over the 8 sphere CRC values. Results are from an EGS4-based simulation.
