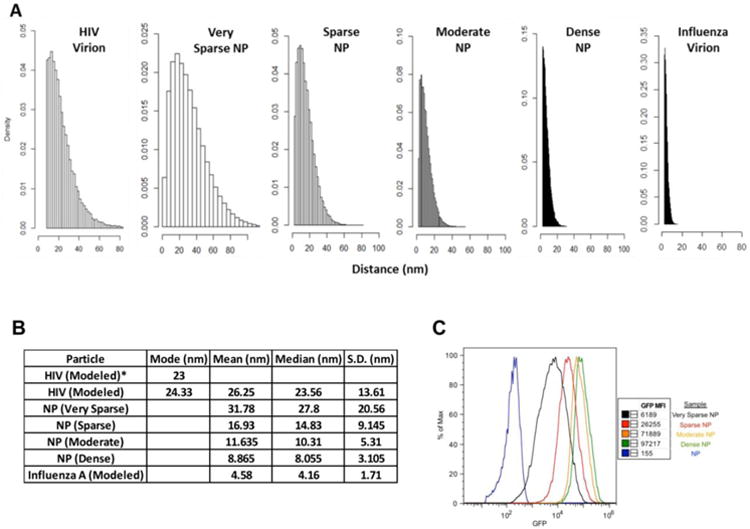
Figure 1.

Analysis of antigen density on 500nm nanoparticles (NPs). Distances between antigens on the indicated particles (virions or nanoparticles) were estimated, using the nearest neighbor algorithm published by Zhu et al [11]. The amount of bound antigen was empirically measured for all decorated NP preparations (see Methods), and was estimated for the virus particles based on published studies [11, 12]. A) Panels show the results of 1500 simulations to determine the distribution of antigen distances on the surface of the NP preparations, versus naturally occurring virions. B) The table summarizes the estimated mean, mode and median distances between individual antigens on the surface of the indicated NPs and virions (along with the corresponding standard deviation). The left column shows the mode values for antigen distance on HIV-1 virions, as previously measured by cryoEM (23 nm) and as measured using our modified simulation (24.3 nm). C) This panel illustrates the relative amount and distribution of antigen on NP preparations. NPs were decorated with biotinylated GFP and analyzed by flow cytometry.
