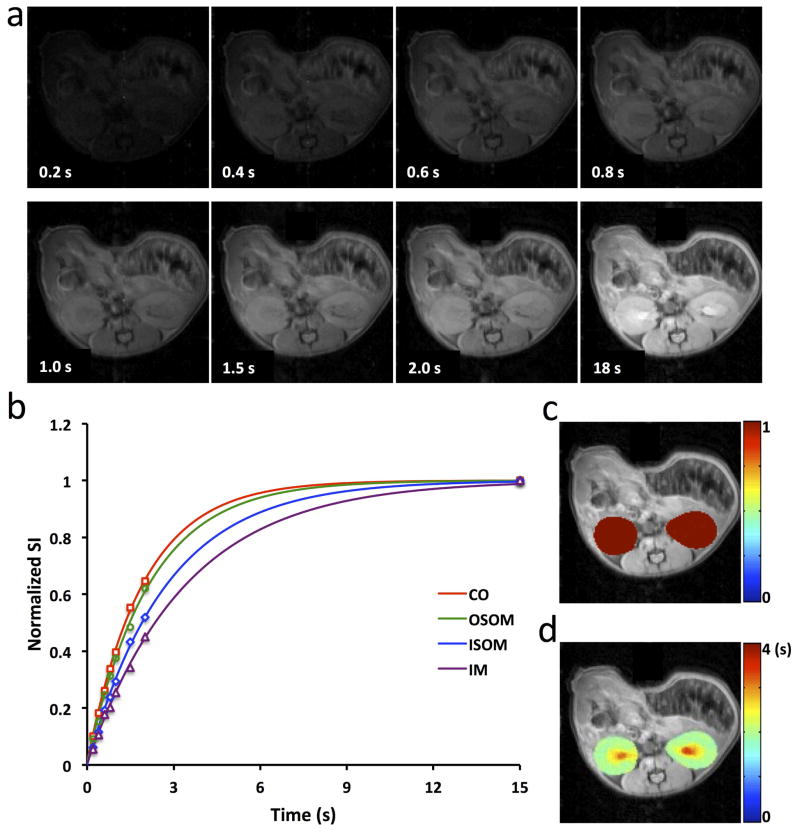
Figure 2. T1 mapping of mouse kidneys.
a. MSRFSE images acquired with varying TD. b. Representative experimental data and mono-exponentially fitted curve for one single pixel in CO, OSOM, ISOM, and IM, respectively. c. The fitted saturation efficiency map overlaid on the M0 image. A good saturation of magnetization was achieved with averaged saturation efficiency larger than 99%. d. The fitted T1 map overlaid on the M0 image.

