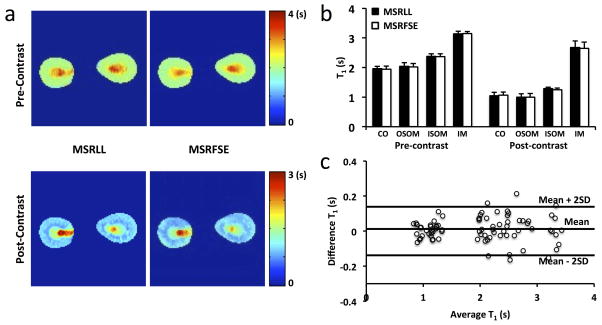
Figure 3. Validation of MSRFSE by MSRLL in vivo.
a. Representative T1 maps acquired at pre- and post-Mn2+ infusion by MSRLL and MSRFSE, respectively. b. Comparison of T1 values quantified in CO, OSOM, ISOM, and IM by MSRLL and MSRFSE. c. Bland-Altman analysis of the measured T1 values by both methods at pre- and post-Mn2+ infusion.

