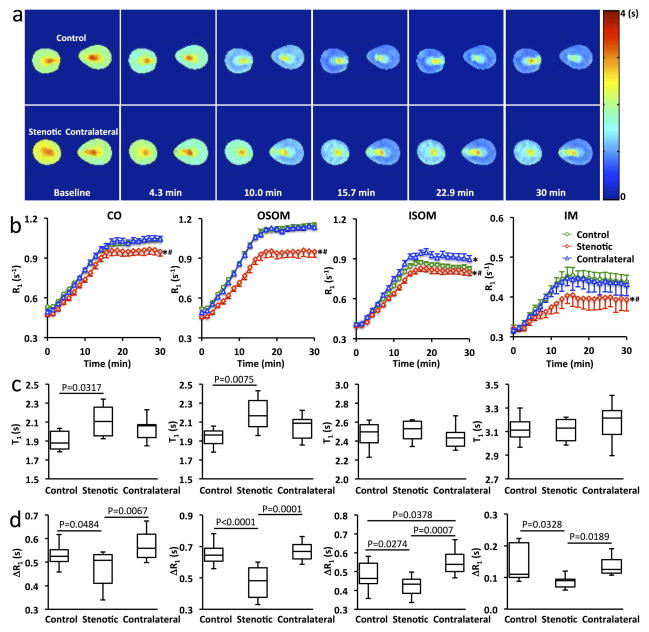
Figure 5. Dynamic MEMRI.
a. Representative T1 maps of the control, stenotic, and contralateral kidneys at baseline and 4.3, 10.0, 15.7, 22.9, and 30 min after the start of Mn2+ infusion. b. Quantified time courses of R1 changes in CO, OSOM, ISOM, and IM of control, stenotic, and contralateral kidneys. Data expressed as mean±standard error. *P<0.05 compared to the control kidney; #P<0.05 compared to the contralateral kidney. c&d. The measured baseline T1 values (c) and R1 changes from baseline to post-contrast (d) in CO, OSOM, ISOM, and IM of control, stenotic, and contralateral kidneys.

