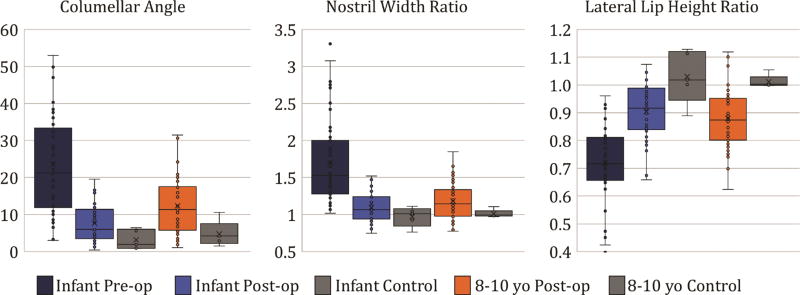
Figure 7. Distribution of anthropometric measurements in groups.
Box-and-whisker plots for the most predictive anthropometric measurements of the 3 image sets. The bottom and top of the boxes mark the first and third quartiles, the bands inside the boxes mark the median (second quartile) and whiskers mark local minimum and maximum (1.5 × interquartile range). Each data point is shown with a filled circle and mean point is marked with an X. Data points lying outside the whiskers are outliers. Red dashed lines show the perfect symmetry. The distribution of measurements was different for each of the 3 image sets. The Infant pre-op group had the widest variation (size of the box), while the Infant post-op group had the smallest variation. The smaller variation suggests more similar appearances, and thus greater difficulty making side-by-side comparisons to rank appearances.

