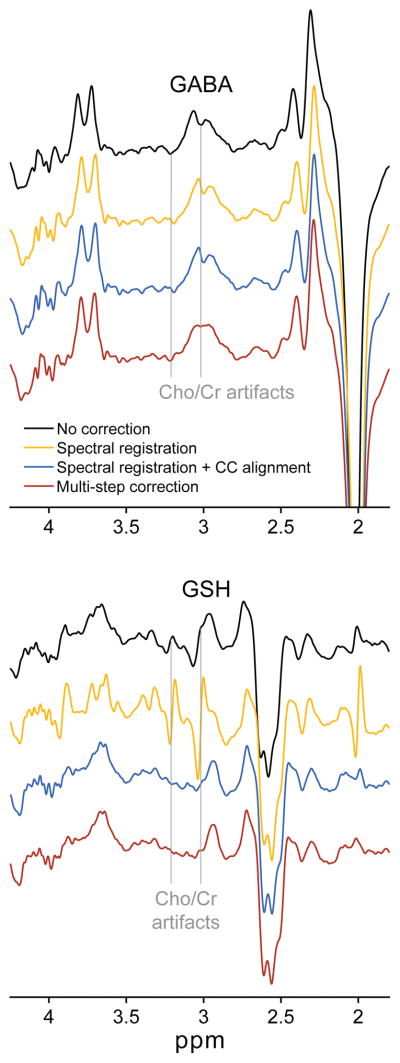
FIG. 3.
Example GABA- (top) and GSH- (bottom) edited DIFF spectra from one dataset frequency- and phase-corrected using each of the four FPC approaches. The two grey vertical lines show the location of Cho/Cr subtraction artifacts in the spectra. Cr subtraction artifacts are clearly seen in the GABA DIFF spectra, while Cho subtraction artifacts are clearly seen in the GSH DIFF spectra. Black = no correction; gold = spectral registration; blue = spectral registration with post hoc Cho-Cr alignment; red = multi-step FPC.

