Figure 2.

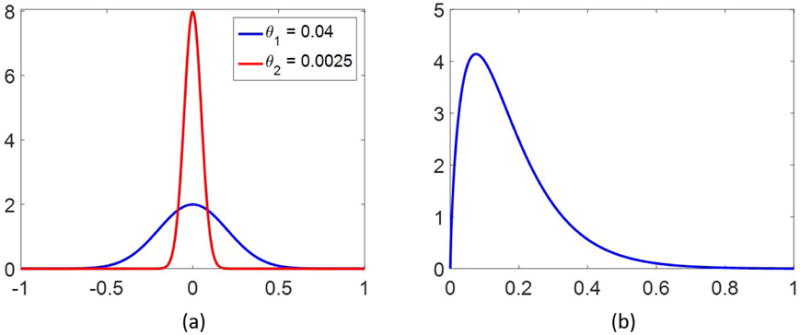
Two normal distributions are plotted in (a), both centered at 0, but with different variances, as noted. In (b) is shown a probability density function of the Gamma distribution with shape parameter α = 1.75 and scale parameter β = 0.1.

Two normal distributions are plotted in (a), both centered at 0, but with different variances, as noted. In (b) is shown a probability density function of the Gamma distribution with shape parameter α = 1.75 and scale parameter β = 0.1.