
Figure 2.
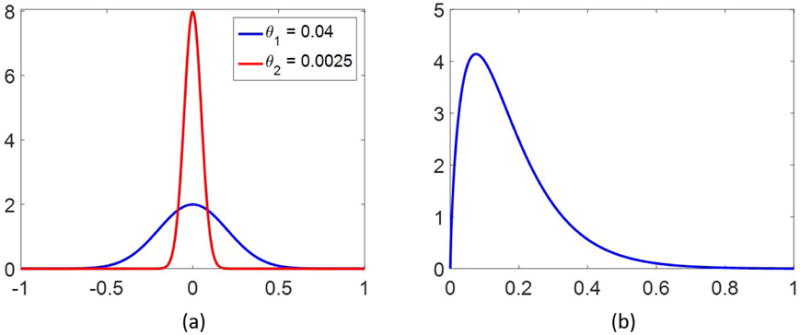
Two normal distributions are plotted in (a), both centered at 0, but with different variances, as noted. In (b) is shown a probability density function of the Gamma distribution with shape parameter α = 1.75 and scale parameter β = 0.1.
Official websites use .gov
A
.gov website belongs to an official
government organization in the United States.
Secure .gov websites use HTTPS
A lock (
) or https:// means you've safely
connected to the .gov website. Share sensitive
information only on official, secure websites.
Two normal distributions are plotted in (a), both centered at 0, but with different variances, as noted. In (b) is shown a probability density function of the Gamma distribution with shape parameter α = 1.75 and scale parameter β = 0.1.