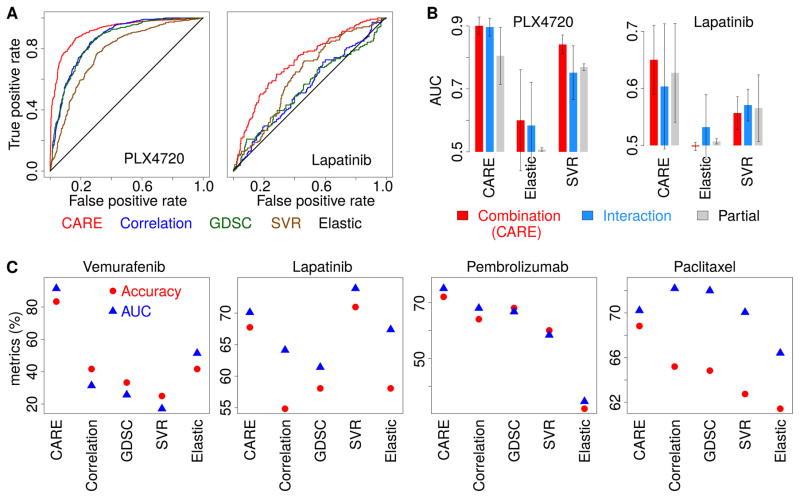
Figure 4. CARE outperforms other computational methods in finding drug efficacy biomarkers.
(A) Performance comparison on predicting transcriptome signatures of drug resistant cell lines. Receiver operating characteristics (ROC) curves were used to compare different computational methods for their performance in predicting gene expression signatures of PLX4720 and lapatinib resistant cell lines.
(B) Performance comparison among model variations. For each method, we computed several variations of scores and compared their performance in predicting drug resistance associated genes as panel A. The mean of the area under ROC curve (AUC) across three screen cohorts are compared among all methods with standard deviations as error bars. Combination: the association calculated for the sum of both interaction and base coefficients. Interaction: only the interaction coefficient. Partial: only the coefficient of each gene P in a model without interactions.
(C) Performance comparison on predicting clinical outcome. For each method, the response was predicted for patients through the correlation between patient gene expression values and the result scores from each model. The accuracy metrics are compared in the same way as Figure 3B.

