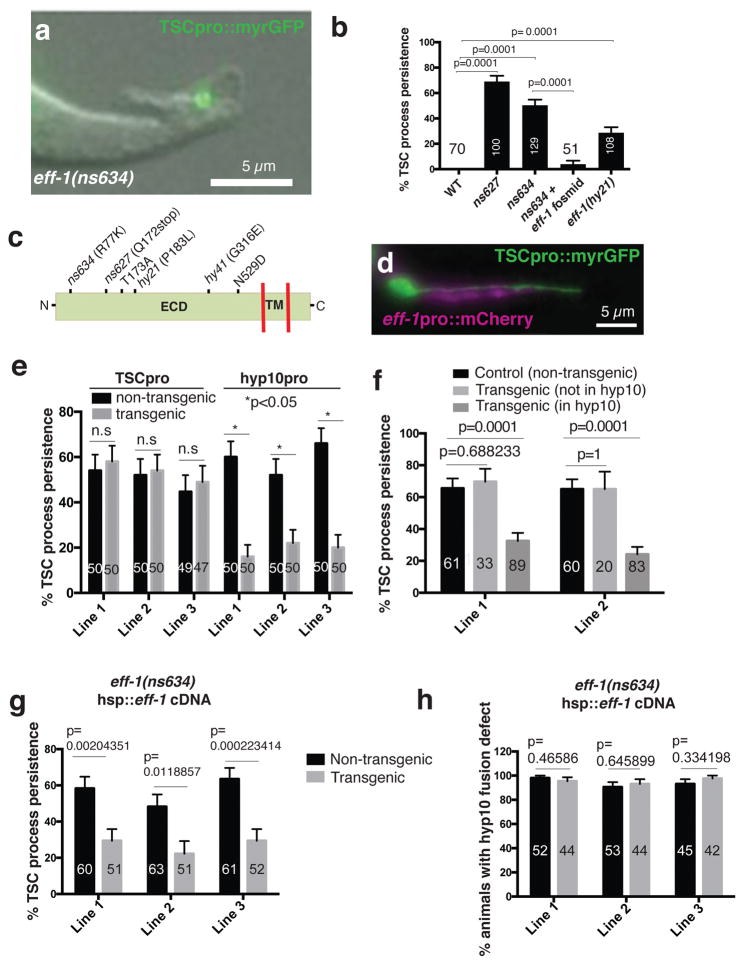
Figure 3. EFF-1 fusogen mediates distal process clearance.
(a) L1 eff-1(ns634) mutant. n=129 biologically independent animals with similar results. (b) Process clearance defects in indicated genotypes. n=sample sizes for statistics are as follows with n referring to number of biologically independent animals.WT: n=70, ns627: n=100, ns634:n=129, ns634+ fosmid: n=51, eff-1(hy21):n=108. (c) EFF-1 structure and mutation sites. ECD, extracellular domain; TM, transmembrane domain. hy41 was previously identified14. (d) ced-3(n717) mutant showing hyp10 eff-1 expression. n=4 biologically independent animals with similar results. (e) eff-1 mutant cell-specific rescue. n=sample sizes for statistics are as follows with n referring to number of biologically independent animals: TSC Line 1: n=50 (non transgenic), n=50 (transgenic); TSC Line 2: n=50 (non transgenic), n=50 (transgenic); TSC Line 3: n=49 (non transgenic), n=47 (transgenic); hyp10 Lines 1–3 each: n=50 (non transgenic), n=50 (transgenic) (f) Mosaic analysis showing EFF-1 function in hyp10 for TSC distal process clearance. n=sample sizes for statistics are as follows, Line 1: Control: 61, Transgenic (not in hyp10): n=33, Transgenic (in hyp10): n=89; Line 2: Control: n=60, Transgenic (not in hyp10): n=20, Transgenic (in hyp10): n=83. (g) Rescue of eff-1 mutant TSC clearance defect with heat-shock promoter::eff-1 cDNA following heat exposure. n=sample sizes for statistics are as follows, Line 1: n=60 (non-transgenic), n=51 (transgenic); Line 2: n=63 (non-transgenic), n=51 (transgenic); Line 3: n=61 (non-transgenic), n=52 (transgenic). (h) Same as g, except rescue of fusion examined. n=sample sizes for statistics are as follows, Line 1: n=52 (non-transgenic), n=44 (transgenic); Line 2: n=53 (non-transgenic), n=44 (transgenic); Line 3: n=45 (non-transgenic), n=42 (transgenic). Data are mean +/− s.e.m. Statistics: two-tailed unpaired t-test. n.s., non significant (p>0.05). Individual p values: see Supplementary Table 2. Numbers inside bars, total animals scored per genotype. For rescue experiments, 2–3 independent transgenic lines were scored. For other experiments, 3 independent scoring experiments were done. For heat-shock rescue, scoring was done 2 hours after heat-shock. Scale bars: 5 μm. Statistics source data are provided in Supplementary Table 2.

