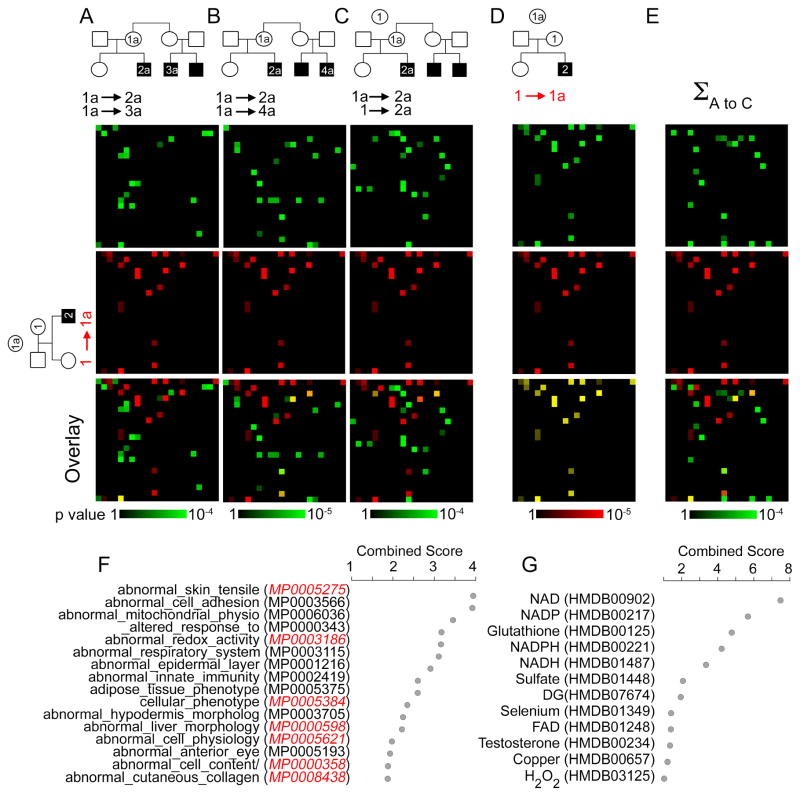
Fig. 4. Bioinformatic Analysis of Genealogical Proteomics from Menkes Disease Pedigrees.
A–E) MGI mouse phenotype ontology analyzed with ENRICHR. Data are depicted as canvases where coordinates are occupied by an individual ontology category. First canvas row depicts SILAC comparing diseased and non-diseased pairs, second row in red depicts non-diseased pair comparison. Third row is their overlay. F) MGI mouse phenotype ontology associated to the copper dyshomeostasis proteome analyzed with ENRICHR depicted as combined score (z-score x −log(p-value)) (Chen et al., 2013; Kuleshov et al., 2016). Red depicts categories found under Atp7a mouse mutations in MGI. G) Human Metabolome Database (HMDB) metabolites associated to the copper dyshomeostasis proteome analyzed with ENRICHR engine depicted as combined score. Individual family and collective bioinformatics data can be found in Supplementary Tables 1–4.

