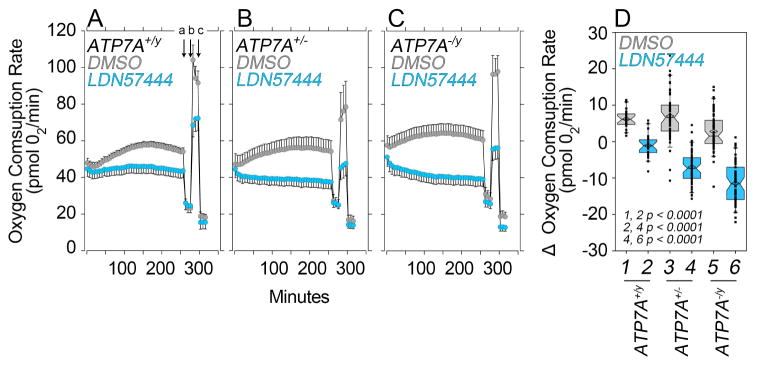
Fig. 6. Mitochondrial Respiration in Cultured Menkes patient fibroblasts is Restored by a UCHL1 inhibitor.
A–C Oxygen consumption rates in wild type (ATP7A+/y), non-diseased mother (ATP7A−/+) and Menkes son (ATP7A−/y) fibroblasts treated with vehicle (grey) and the UCHL1 inhibitor LDN57444 (cyan) for 250 min while performing Seahorse analysis. Average ± SE, n=5. D) Box plot presents the acute responses per genotype expressed as the O2 consumption rate change as compared to pre-vehicle or drug-addition. Note that the inhibitor effect on respiration increases with the gene dosage reduction of ATP7A. Mann-Whitney Rank Sum Test, n1-n6= 21, 22, 50, 58, 56, 60 respectively. Box plots depict percentiles fifth and 95th. Box line represents sample median and diamonds sample mean and notches mark the half-width.

