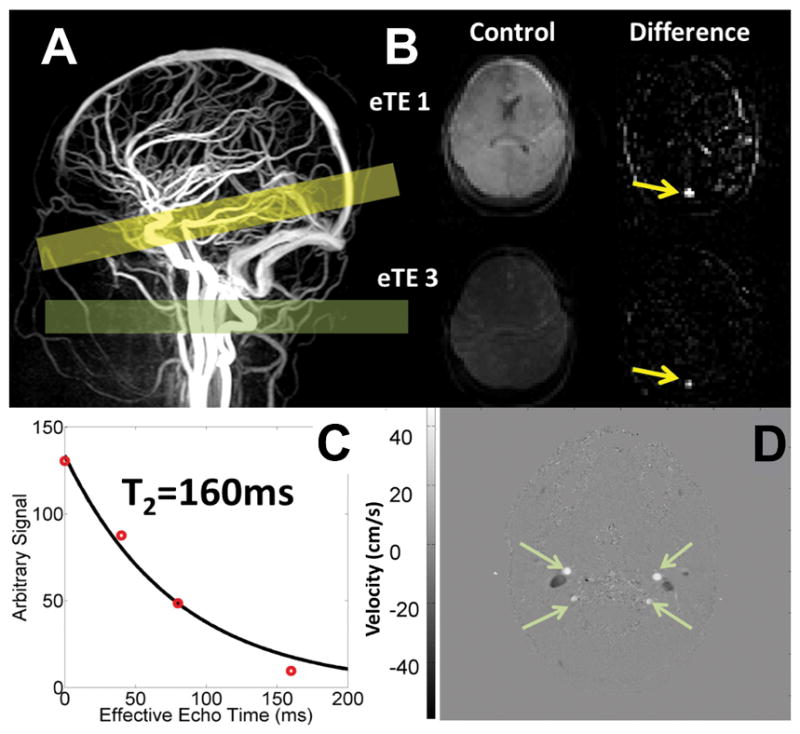
Figure 2.

A) Head and neck angiogram and the localization of the TRUST imaging plane (yellow bar) and the Phase Contrast imaging plane (green bar). B) Representative TRUST images showing the anatomical, control images the first and third effective echo time and the resulting difference image upon subtraction of the control and labeled TRUST images. Yellow arrows correspond to the isolated blood signal in the sagittal sinus of the difference images. C) Mono-exponential fitting of all four difference images is then performed to estimate T2b that is then converted to a blood oxygenation value using empirically derived blood calibrations. Phase contrast (D), phase based velocity image of the four major cerebral feeding vessels of the neck demonstrate how velocity and global CBF can be quantified.
