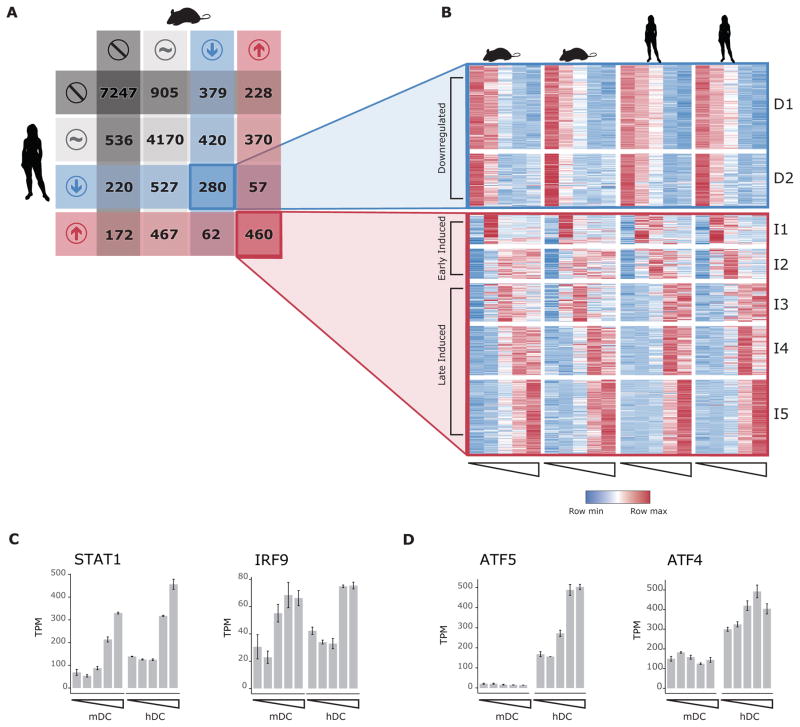
Figure 1. Highly induced LPS-responsive genes have similar expression kinetics in human and mouse dendritic cells.
A) Classification of 16,500 homolog genes in mouse and human as not expressed (dark grey), expressed without significant change after LPS stimulation (light grey), downregulated (blue) or induced (red) B) Heatmap showing normalized expression values for genes with shared response to LPS across five timepoints (Unstimulated, 1h, 2h, 4h and 6h post-LPS) in DCs derived from two different C57BL/6 mouse (left) and two human donors (right). Genes were grouped by spectral clustering into two clusters of shared downregulated genes (D1 and D2, top), and five clusters of shared induced genes (I1-I5, bottom). Induced gene clusters can be classified as early (I1 and I2) or late (I3, I4 and I5). C) Average normalized expression (TPM) for two shared late induced transcription factors (TFs), Stat1 and Irf9. D) Average normalized expression (TPM) for ATF family TFs with species-specific response.

