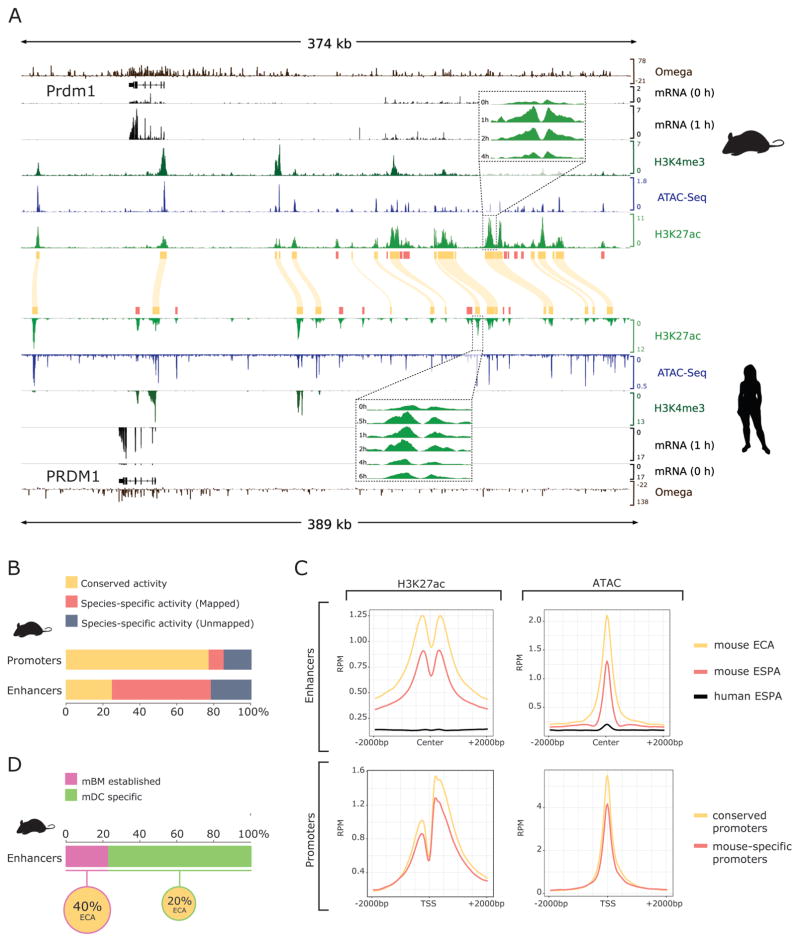
Figure 2. Rapid turnover of enhancer elements.
A) Integrative Genome Viewer diagram of the PRDM1 regulatory region in both mouse (top) and human (bottom) displaying the data used in this study. Tracks display from top to bottom: sequence conservation as estimated by SiPhy (Omega), RefSeq gene annotations, RNA-Seq coverage for unstimulated and one hour post-LPS, overlaid H3K4Me3, ATAC and H3K27ac coverage. Human data in reverse orientation, yellow boxes and curved lines indicate conserved H3K27ac peaks (regulatory regions with conserved activity: promoters or ECAs). Inlets show individual tracks for H3K27ac time course after LPS stimulation. Red boxes indicate H3K27ac peaks with species-specific activity. B) Proportion of regulatory regions with conserved activity: conserved promoters or ECAs, mouse-specific with clear human homologous sequence (mapped promoters or ESPA) and mouse-specific with no clear homologous sequence in human (unmapped promoters or ESPA) C) Average signal for mouse H3K27ac (left) and ATAC-Seq (right) signal over regulatory elements. Enhancer (top) H3K27ac or ATAC-Seq signal is centered in open regions, defined by ATAC-Seq peaks. Promoter (bottom) H3K27ac or ATAC-Seq signal is centered in the TSS. Data is shown for conserved enhancers and promoters (yellow), mouse-specific enhancers and promoters (red) and all other mouse genome coordinates for mapped human-specific enhancers and promoters (black). RPM = reads per million mapped reads D) Fraction of mouse enhancers that are active (pre-established) in bone marrow (mBM) cells and enhancers that are mDC specific, and fraction of mBM pre-established or mDC specific enhancers that are conserved (ECA).

