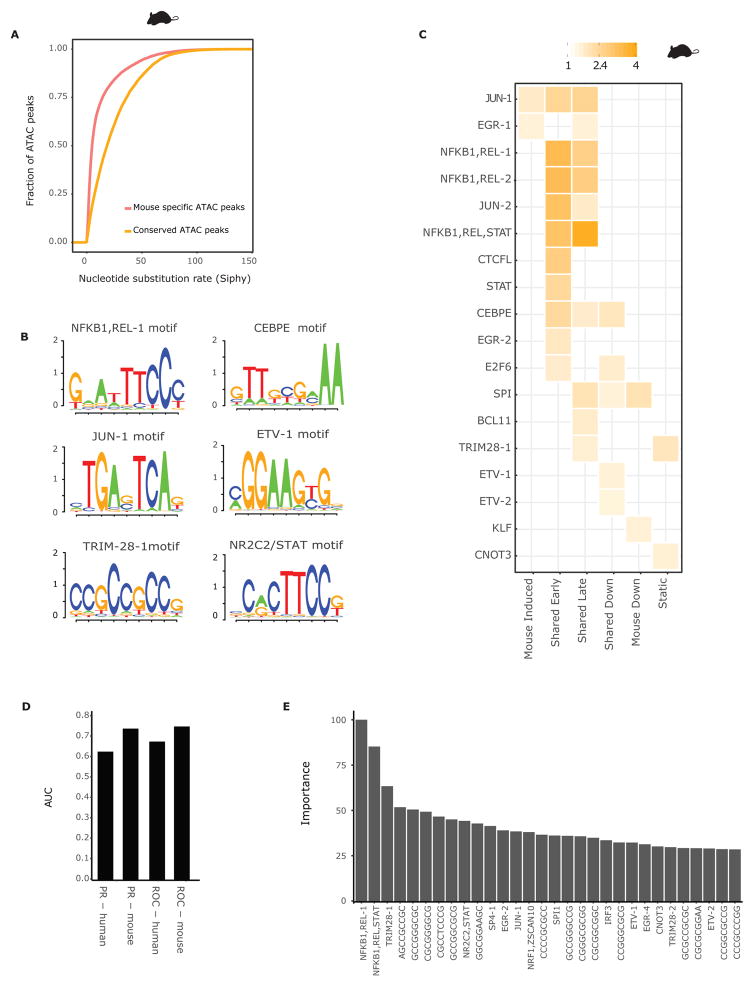
Figure 4. Enhancers with conserved activity contain a conserved lexicon.
A) Distribution of SiPhy omega log-odds scores for 200bp regions around the summits of ATAC-seq peaks that have conserved signal (yellow) and species-specific signal (red) in mouse DCs. B) Examples of sequence logos of the clusters of kmers obtained after clustering the sequences in ATAC regions with conserved signal that have a log-odds score greater than 30. C) Enrichment heatmap showing the observed over expected values for each motif in ATAC-seq peaks with conserved signal associated to the gene groups defined in Figure 1. D) AUC of the PR and ROC curves of a random forest model, predicting whether a gene will be induced or maintain constant expression following LPS stimulation. The features were the number of instances of each cPWM across all regulatory regions of a gene. E) Feature importance of the classifier, defined as the difference in mean accuracy across all trees between the model and the model after permuting the feature. The importance values were then scaled to span the range of 0 to 100. The 30 features with the highest importance values are shown.

