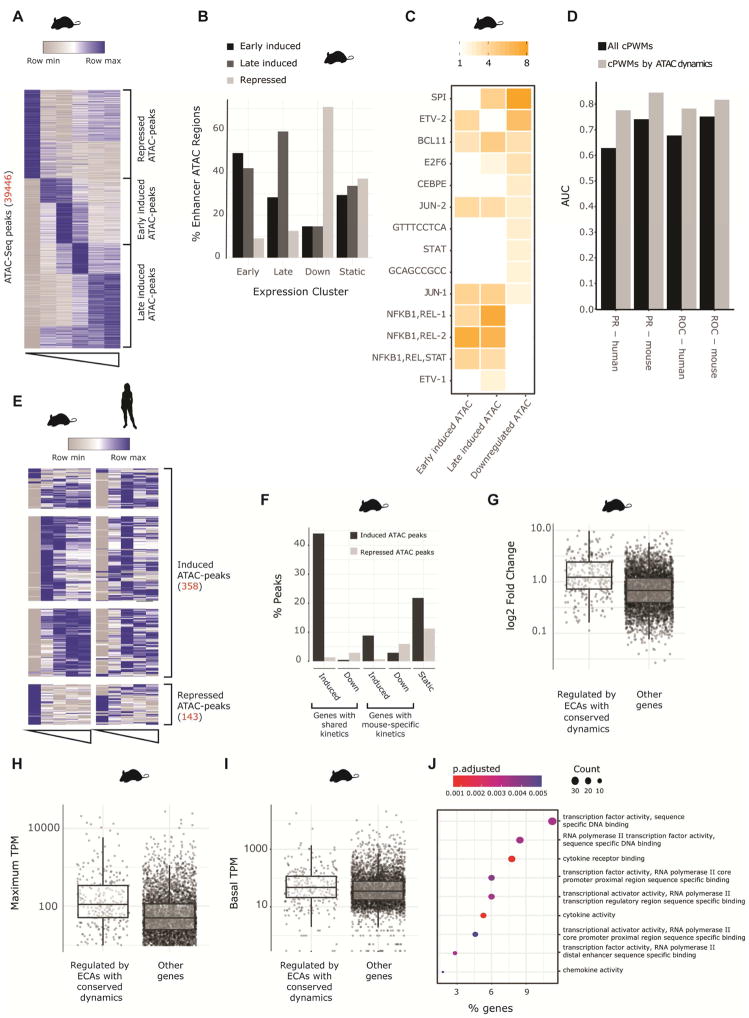
Figure 6. Regulatory regions with conserved activity and conserved kinetics regulate genes with shared induction kinetics.
A) Heatmap showing k-means clustering of temporal patterns of mean signal per bp for ATAC-Seq peaks (at enhancer or promoter regions) with dynamic response to LPS in mouse DCs (Unstimulated, 30 minutes, 1 hours, 2 hours, 4 hours and 6 hours). Regions were classified as repressed, early induced or late induced. B) Fraction of early induced, late induced, downregulated or non-changing genes that are associated to dynamic ATAC peaks. C) Enrichment of cPWMs in ATAC peaks that are under purifying selection (Fig 4A) clustered into temporal groups. D) AUC of the PR and ROC curves of a random forest model, predicting whether a gene will be induced or maintain constant expression following LPS stimulation. The features for each model were the number of instances of each cPWM across all regulatory regions of a gene (black bars), or all instances separated by the temporal pattern of the regulatory element (grey bars) E) Heatmap showing the temporal patterns of ATAC-seq peaks with conserved signal that are dynamic in both mouse and human. F) Enrichment of ATAC-seq peaks with conserved signal associated to genes that are induced in both mouse and human DCs, induced only in mouse DCs, downregulated in both mouse and human DCs, downregulated only in mouse DCs and not responsive to LPS in mouse DCs. G-I) The maximum absolute fold change, maximum tpm and baseline tpm of genes that are associated with ATAC-seq peaks with conserved signal that have same temporal response in both mouse and human versus all other genes J) Gene ontology analysis of genes associated with regulatory regions with conserved LPS response kinetics.

