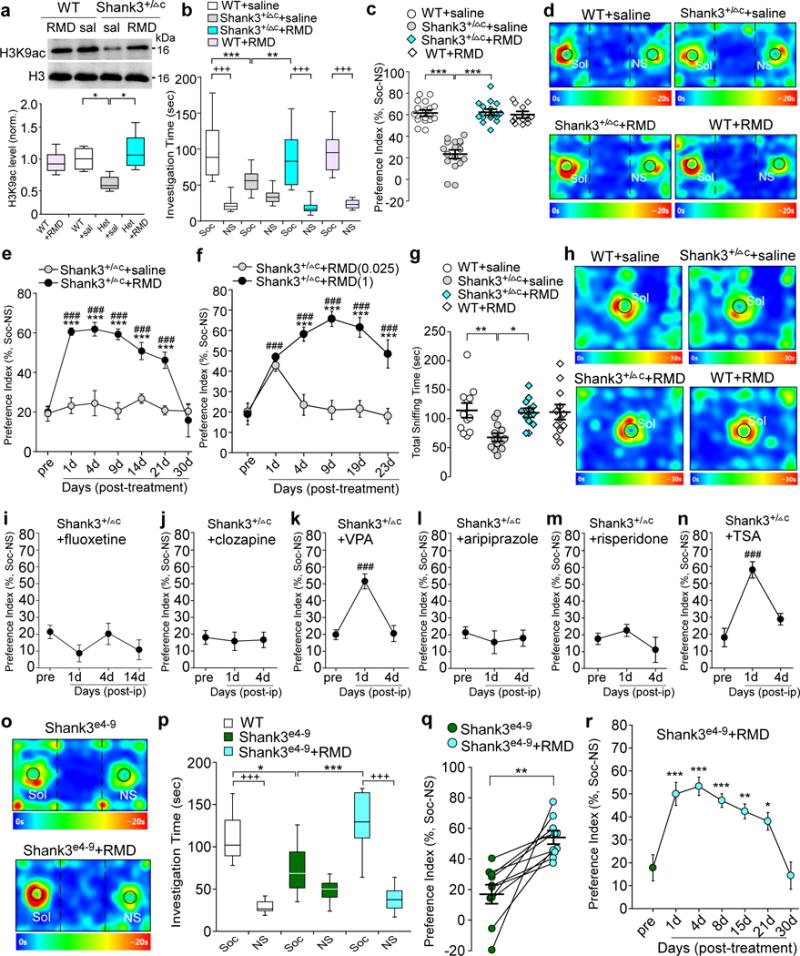
Figure 1. Treatment with the HDAC inhibitor romidepsin induces the robust and prolonged rescue of autism-like social deficits in Shank3-deficient mice, while a variety of drugs for psychiatric disorders fail to do so.

(a) Immunoblots and quantification analysis of the level of acetylated H3 and total H3 in the nuclear fraction of cortical slices from wild-type (WT) or Shank3+/ΔC (Het) mice injected (i.p.) with saline or romidepsin (RMD, 0.25 mg/kg, 3×). Immunoblotting was performed at 4-5 days post-injection. F1,20=11.3, P=0.0031; * P<0.05, two-way ANOVA, n=6 each group. (b, c) Plots showing the time spent investigating either the social (Soc) or nonsocial (NS) stimulus (b) and the social preference index (c) during 3-chamber sociability testing of saline-injected WT (n=18), saline-injected Shank3+/ΔC (n=17), RMD-treated Shank3+/ΔC (n=17) and RMD-treated WT (n=12) mice. In (b), F3,120=11.4, P<0.0001; +++ P<0.001 (Soc vs. NS), ** P<0.01, *** P<0.001, two-way ANOVA. In (c), F1,60=58.5, P<0.0001; *** P<0.001, two-way ANOVA. (d) Representative heat maps illustrating the time spent in different locations of the 3 chambers from the social preference tests of all groups. Locations of Sol and NS stimuli are labeled with the circles. (e) Plots of social preference index in Shank3+/ΔC mice treated with romidepsin (n=10) or saline (n=10) at different time points. F1,18(treatment)=124.3, P<0.0001; *** P<0.001 (saline vs. romidepsin), ### P<0.001 (pre- vs. post-injection), two-way rmANOVA. (f) Plots of social preference index in Shank3+/ΔC mice treated with different doses of romidepsin (0.025 mg/kg, n=9; 1 mg/kg, n=8) at different time points. F1,15(treatment)=51.3, P<0.0001; *** P<0.001 (1 mg/kg vs. 0.025 mg/kg RMD); ### P<0.001 (pre- vs. post-injection), two-way rmANOVA. (g) Scatter plots showing total sniffing time in social approach tests of saline-injected WT (n=12), saline-injected Shank3+/ΔC (n=14), RMD-treated Shank3+/ΔC (n=12) and RMD-treated WT (n=12) mice. F1,46=6.0, P=0.018; * P<0.05, ** P<0.01, two-way ANOVA. (h) Representative heat maps illustrating the time spent in different locations of the apparatus from the social approach tests of all groups. Locations of social stimuli are labeled with the circles. (i-n) Plots of social preference index in Shank3+/ΔC mice treated with fluoxetine (10 mg/kg, i.p., 14×, i, n=9), clozapine (5 mg/kg, i.p., 3×, j, n=11), valproic acid (VPA, 100 mg/kg, i.p., 3×, k, n=11), aripiprazole (1 mg/kg, i.p., 3×, l, n=9), risperidone (0.1 mg/kg, i.p., 3×, m, n=10), or Trichostatin A (TSA, 0.5 mg/kg, i.p., 3×, n, n=8). F2,30=19.2 (VPA), P<0.0001; F2,21=19.7, P<0.0001 (TSA); ### P<0.001 (pre- vs. post-injection), one-way ANOVA. (o) Representative heat maps illustrating the time spent in different locations of the 3 chambers from the social preference tests of a Shank3e4-9 mouse before and after romidepsin treatment (0.25 mg/kg, i.p., 3×). (p) Box plots showing the time spent investigating either Soc or NS stimulus during sociability testing in WT (n=8) or homozygous Shank3e4-9 mice (n=10) before and after romidepsin treatment. F2,50=9.2, P=0.0003; +++ P<0.001 (Soc vs. NS), * P<0.05, *** P<0.001, two-way ANOVA. (q) Scatter plots showing the preference index of the sociability testing in individual Shank3e4-9 mice before and after romidepsin treatment (n=10). t9=4.36, ** P=0.0018, paired two-tailed t-test. (r) Plots of social preference index in Shank3e4-9 mice (n=10) treated with romidepsin at different time points. F6,63=11.8, P<0.0001; * P<0.05, ** P<0.01, *** P<0.001 (pre- vs. post-injection), one-way ANOVA. Shank3+/ΔC mice (a-n) and WT mice (a-n,p) are all males (5-6 weeks old); Shank3e4-9 mice (o-r) are 6 males and 4 females (5-6 weeks old). Data are presented as median with interquartile range (a,b,p) or mean ± SEM (c,e-g,i-n,q,r). Each set of the experiments was replicated for at least 3 times. See Supplementary Fig. 8 for blot source data.
