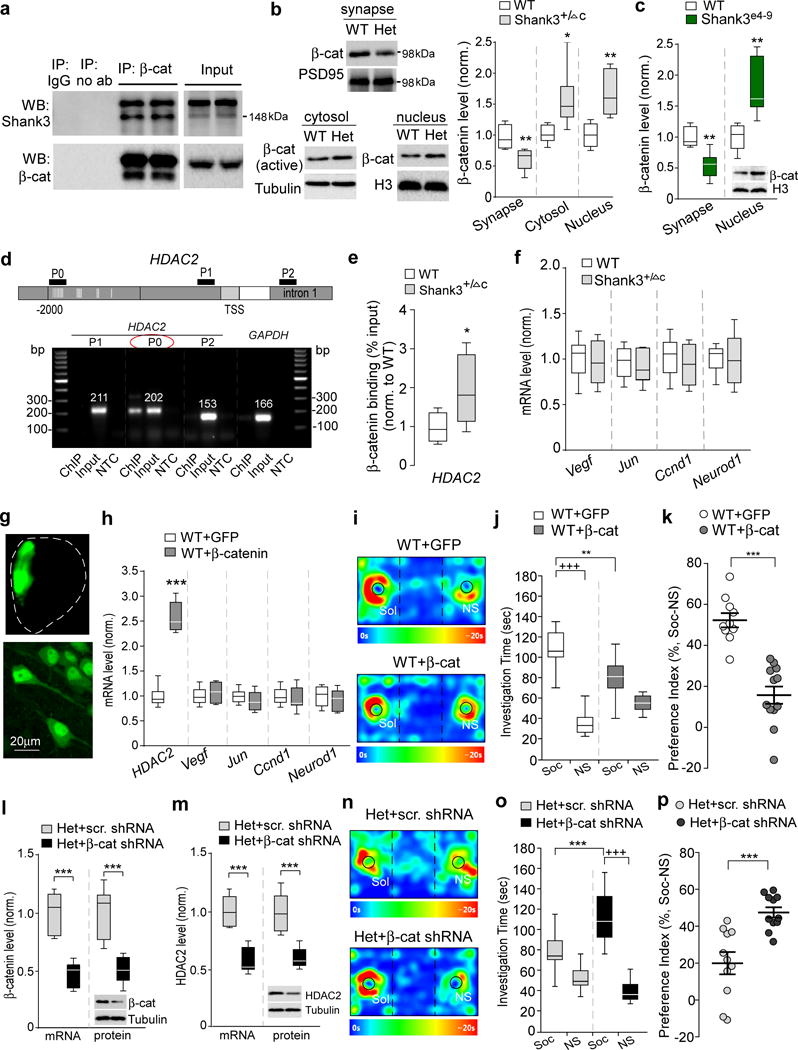
Figure 4. β-catenin is nuclear-translocated to activate HDAC2 transcription in Shank3-deficient mice, and manipulation of β-catenin directly affects HDAC2 transcription and social behaviors.

(a) Co-immunoprecipitation data from cortical lysates of WT mice showing the specific binding of β-catenin to Shank3. (b) Immunoblots and quantification analysis of the level of β-catenin in synaptic membrane, cytosol or nuclear fractions of cortical slices from WT and Shank3+/ΔC (Het) mice. t10=3.35, ** P=0.0074 (synapse), t10=2.78, * P=0.0194 (cytosol), t10=4.01, ** P=0.0025 (nucleus), n=6 each group, two-tailed t-test. (c) Quantification analysis of synaptic and nuclear β-catenin levels in cortical slices from WT and Shank3e4-9 mice. t10=4.33, ** P=0.0015 (synapse), t10=3.82, ** P=0.0034 (nucleus), n=6 each group, two-tailed t-test. (d) PCR images showing the ChIP (β-catenin-occupied DNA), input (total DNA) and no-template control (NTC) signals with 3 primers (P0, P1, P2) designed against different regions of the HDAC2 gene, including the promoter region containing (P0) or lacking (P1) the TCF/LEF binding motif (labeled with vertical lines) and a down-stream intron (P2). TSS, transcriptional start site. GAPDH was used as a control. (e) ChIP assay data showing the binding of β-catenin at HDAC2 promoter region (containing TCF/LEF binding motif) in PFC lysates from WT and Shank3+/ΔC mice. t12=2.6, * P=0.02, n=7 each group, two-tailed t-test. (f) Quantitative real-time RT-PCR data on the mRNA level of other β-catenin target genes (Vegf, Jun, Ccnd1, and Neurod1) in PFC from WT and Shank3+/ΔC mice (n=8 each group). (g) Images showing the β-catenin (GFP-tagged) adenovirus-infected medial PFC region (top) and PFC neurons (bottom). (h) qPCR data on the mRNA level of HDAC2 and other β-catenin target genes in PFC of WT mice with the overexpression of GFP-tagged β-catenin (n=10) or GFP control (n=8). t16=13.44, *** P<0.0001 (HDAC2), two-tailed t-test. (i-k) Representative heat maps (i), plots of social interaction time (j) and social preference (k) in 3-chamber sociability tests of WT mice with the overexpression of β-catenin (n=12) or GFP control (n=10) in PFC. j: F1,40=20.5, P<0.0001; +++ P<0.001 (Soc vs. NS), ** P<0.01 (GFP vs. β-catenin), two-way ANOVA. k: t20=6.4, *** P<0.0001, two-tailed t-test. (l, m) qPCR and Western blot data showing the mRNA and protein level of β-catenin (l) and HDAC2 (m) in Shank3+/ΔC mice with the stereotaxic injection of β-catenin shRNA or a scrambled shRNA lentivirus into the PFC. In (I), t10=6.47, *** P<0.0001 (β-catenin mRNA); t10=4.88, *** P=0.0006 (β-catenin protein). In (m), t10=6.20, *** P=0.0001 (HDAC2 mRNA); t10=5.05, *** P=0.0005 (HDAC2 protein), n=6 each group, two-tailed t-test. (n-p) Representative heat maps (n), plots of social interaction time (o) and social preference (p) in 3-chamber sociability tests of Shank3+/ΔC mice injected with β-catenin shRNA (n=11) or a scrambled shRNA (n=11) lentivirus into the PFC. o: F1,40=15.0, P=0.0004; +++ P<0.001 (Soc vs. NS), *** P<0.001 (β-catenin shRNA vs. scrambled shRNA), two-way ANOVA. p: t20=4.36, *** P=0.0003, two-tailed t-test. All animals used are males (5-8 weeks old). Data are presented as median with interquartile range (b,c,e,f,h,j,l,m,o) or mean ± SEM (k,p). Each set of the experiments was replicated for at least 3 times. See Supplementary Fig. 8 for blot source data.
