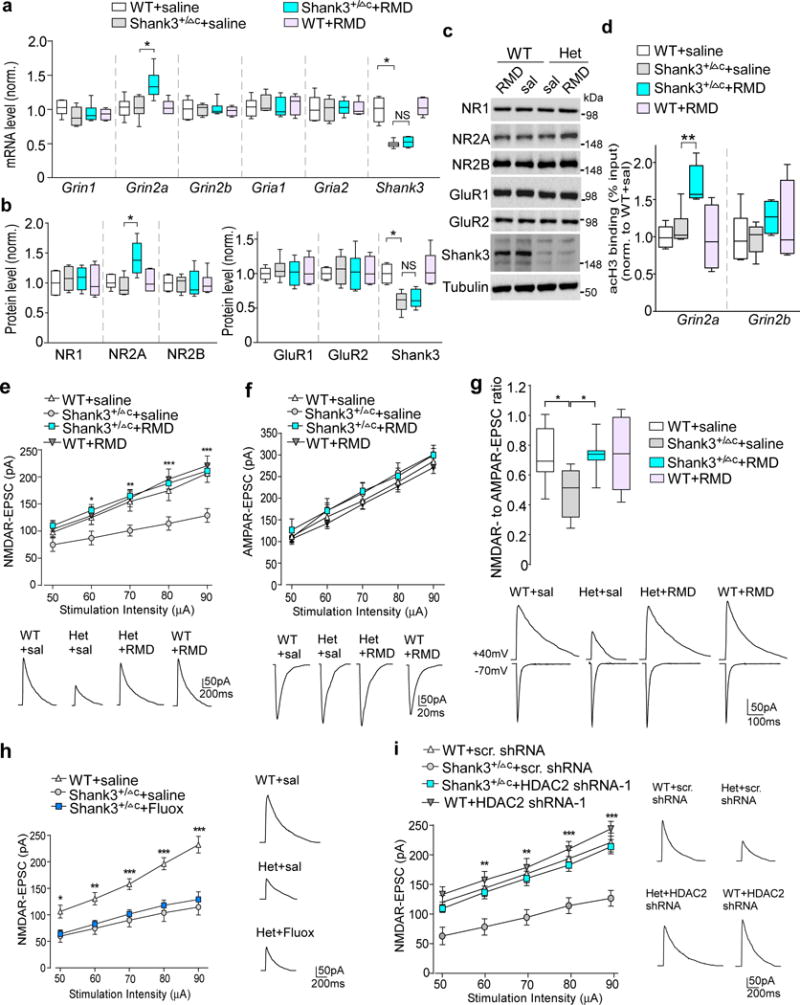
Figure 5. Romidepsin treatment increases Grin2a transcription and histone acetylation, and restores NMDAR synaptic function in PFC of Shank3-deficient mice.

(a) Quantitative real-time RT-PCR data on the mRNA level of NMDAR and AMPAR subunits and Shank3 in PFC slices from saline-injected WT (n=8), saline-injected Shank3+/ΔC (n=8), romidepsin (RMD, 0.25 mg/kg, 3×)-treated Shank3+/ΔC (n=10) and RMD-treated WT (n=6) mice. F1,28(treatment)=5.96, P=0.021 (Grin2a); F1,28(treatment)=0.52, P=0.48 (Shank3); * P<0.05; ns, not significant, two-way ANOVA. (b, c) Quantification analysis and representative immunoblots of the protein level of NMDAR and AMPAR subunits and Shank3 in PFC slices from WT or Shank3+/ΔC mice injected with saline or romidepsin. F1,20(treatment)=5.58, P=0.030 (Grin2a); F1,20(treatment)=0.62, P=0.44 (Shank3); * P<0.05, two-way ANOVA, n=6 each group. (d) ChIP assay data showing the acetylated histone H3 level at Grin2a and Grin2b promoter regions in PFC lysates from saline-injected WT (n=6), saline-injected Shank3+/ΔC (n=6), RMD-treated Shank3+/ΔC (n=6) and RMD-treated WT (n=4) mice. F1,18(treatment)=5.88, P=0.026 (Grin2a); ** P<0.01, two-way ANOVA. (e, f) Input-output curves of NMDAR-EPSC (e) and AMPAR-EPSC (f) in PFC pyramidal neurons from WT vs Shank3+/ΔC mice treated with romidepsin or saline (n=16 cells/4 mice each group). Recordings were performed at 4-5 days post-injection. In (e), * P<0.05, ** P<0.01, *** P<0.001 (Shank3+/ΔC+RMD vs. Shank3+/ΔC+saline), two-way rmANOVA. Inset: representative NMDAR-EPSC and AMPAR-EPSC traces. (g) Box plots showing the NMDAR-EPSC to AMPAR-EPSC ratio in PFC pyramidal neurons from WT vs Shank3+/ΔC mice treated with romidepsin or saline. Inset: representative EPSC traces. F1,36=4.8, P=0.036; * P<0.05, two-way ANOVA, n=10 cells/3 mice each group. (h) Input-output curves of NMDAR-EPSC in Shank3+/ΔC mice treated with fluoxetine (5 mg/kg, i.p., 14×). Inset: representative NMDAR-EPSC traces. * P<0.05, ** P<0.01, *** P<0.001 (Shank3+/ΔC+fluoxetine vs. WT+saline), two-way rmANOVA, n=12 cells/3 mice each group. (i) Input-output curves of NMDAR-EPSC in PFC pyramidal neurons of WT or Shank3+/ΔC mice with the PFC injection of a HDAC2 shRNA or a scrambled control shRNA lentivirus. ** P<0.01, *** P<0.001 (Shank3+/ΔC+HDAC2 shRNA vs. Shank3+/ΔC+scrambled shRNA), two-way rmANOVA, n=12 cells/3 mice each group. All animals used are males (5-6 weeks old). Data are presented as median with interquartile range (a,b,c,g) or mean ± SEM (e,f,h,i). Each set of the experiments was replicated for at least 3 times. See Supplementary Fig. 9 for blot source data.
