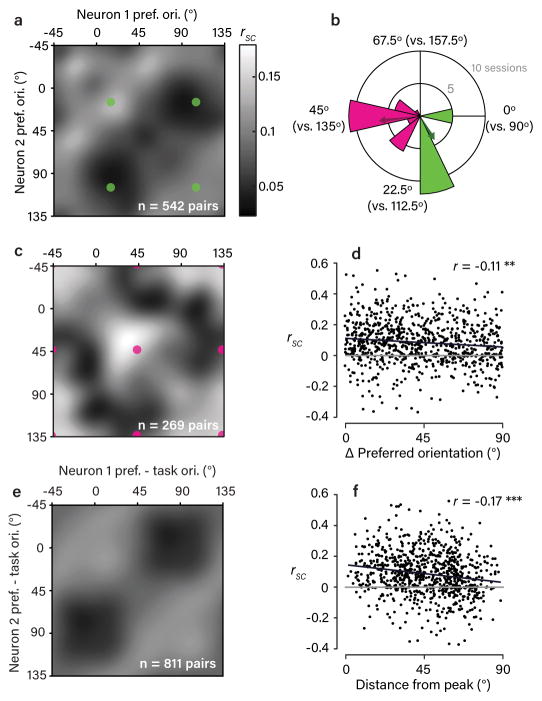
Figure 2. Rsc structure in V1 depends systematically on task context.
a,c. Observed rsc matrices for the two subsets of sessions grouped by task context, as indicated in (b). The matrices were obtained by pooling the set of rsc measurements made within each subset and applying a von Mises smoothing kernel (approximating a 2D wrapped Gaussian with 15º s.d.). Colored dots correspond to pairs preferring the same or opposing task orientations. b. Polar histogram shows the distribution of task contexts used across sessions, with color indicating the division into two subsets. Note that the period is 90º because of the orthogonality of the discriminanda. Colored arrows indicate the mean task context associated with each subset. d. Scatter plot showing a weak, but significant, dependence of rsc on the difference in preferred orientation of neuronal pairs (Pearson’s r = –0.11, P = 9 × 10⁻⁴, bootstrap test, one-sided). Black line is (type II) regression line and grey line corresponds to rsc=0. e. Average rsc matrix observed across all session, shown in a task-aligned coordinate frame. Each pair’s preferred orientations are expressed relative to the task orientations (defined as 0º and 90º). Color scale as in (a). f. Scatter plot showing a significant dependence of rsc on distance from the peak (0º/0º or 90º/90º) in the matrix in (e). This dependence was stronger than the dependence on difference in preferred orientation (r=−0.17, p=1.63*10−6, bootstrap test, one-sided), suggesting the task-aligned pattern we observed captures a more important feature of rsc structure. Black and grey lines as in (d).

