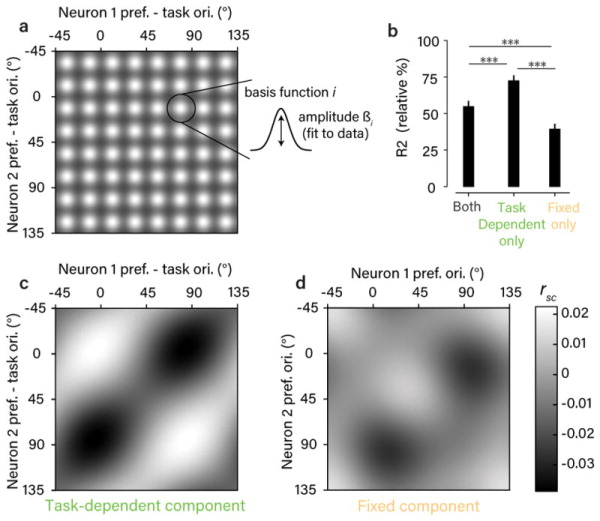
Figure 3. Segregating fixed and task-dependent components of rsc structure.

a. Schematic of the regression model used to estimate fixed and task-dependent components of rsc structure. Each component was a matrix composed of a grid of 8×8 von Mises basis functions, with amplitudes fit to the observed rsc measurements. b. Goodness-of-fit for the model that included both components and for two reduced models that included only one of the two components. Values are expressed relative to an estimate of the explainable variance in the data (see Methods). Error bars are +/− 1 SEM obtained from repeated 50-fold cross-validation. Statistical differences in goodness-of-fit (p<0.001 in all cases) were based on a one-sided test obtained in the same way. c,d. Estimated components from the combined model. The amplitude of the task-dependent component (c) was considerably larger than the fixed component (d) by a factor of 2.1 (computed using the varance across the fitted basis function amplitudes), and closely resembled the lattice-like shape of the task-aligned, average rsc matrix (Fig. 2e). Note that orientation preferences for the task-dependent component are expressed relative to the task orientations. Mean rsc values are close to 0 due to the inclusion of a model constant.
