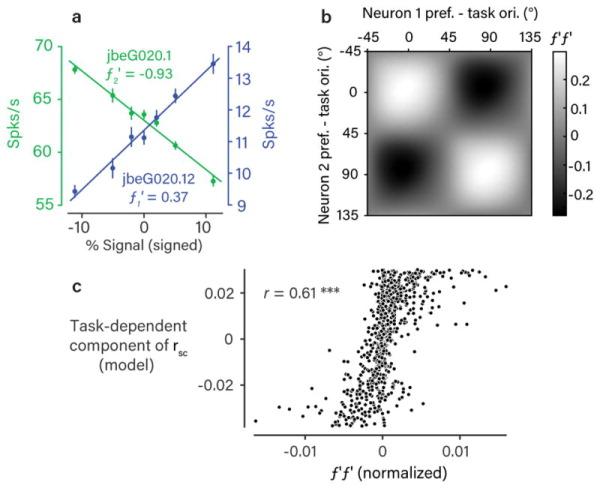
Figure 5. Rsc structure matches effect of task-related stimulus variability.

a. Responses (mean +/− 1 SEM, n=1,049 trials) to the stimuli used in the task at various signal strengths for two example neurons. For the purposes of illustration, the two task orientations are simply labeled positive and negative. This pair was typical in that the response functions (f1 and f2) are approximately linear over the range of signal strengths used. For this reason, we calculated the response correlation introduced by tuning similarity as the normalized product of the derivatives f1′f2′ 16. b. The matrix of f′f′ values, as a function of task-aligned pairwise orientation preference, obtained using kernel smoothing as in Fig. 2. We observed a pattern that was very similar to the structure of rsc we observed during task performance (Fig. 2e). c. Scatter plot of the task-dependent (putatively top-down) component of rsc (Fig. 3c) against normalized f′f′ values for each recorded neuronal pair. The two were highly correlated across the population (Pearson’s r=0.61, p<0.001, bootstrap test, one-sided).
