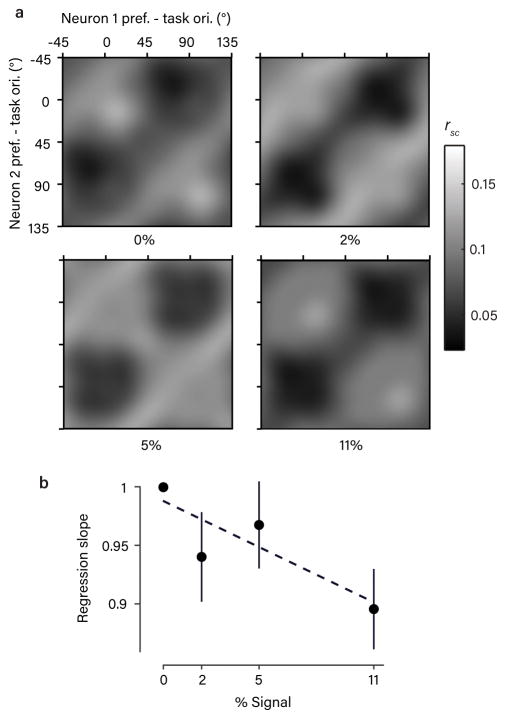
Figure 6. Rsc structure depends on variability in choice.
a. The average, task-aligned rsc matrix (as in Fig. 2e), shown separately for each stimulus strength. Note that 0% signal trials involved statistically identical stimuli across all task contexts. A qualitatively similar structure was apparent at non-zero signal levels. (Spike counts were z-scored to eliminate the effect of stimulus drive; see Methods). b. Scatter plot showing the slope of a regression line comparing the rsc values measured at each signal level against the rsc values measured at the 0% signal level. This quantity indicates the degree of attenuation of the rsc structure at a given signal level. We observed a weak but significant negative correlation (Pearsons’s r, p=0.038, bootstrap test, one-sided) with signal strength (error bars are +/− 1 bootstrap SEM around the mean of the 811 pairs), implying the rsc structure is attenuated on high-signal trials, when there was also less variability in choice. Dotted line is fitted regression line.

