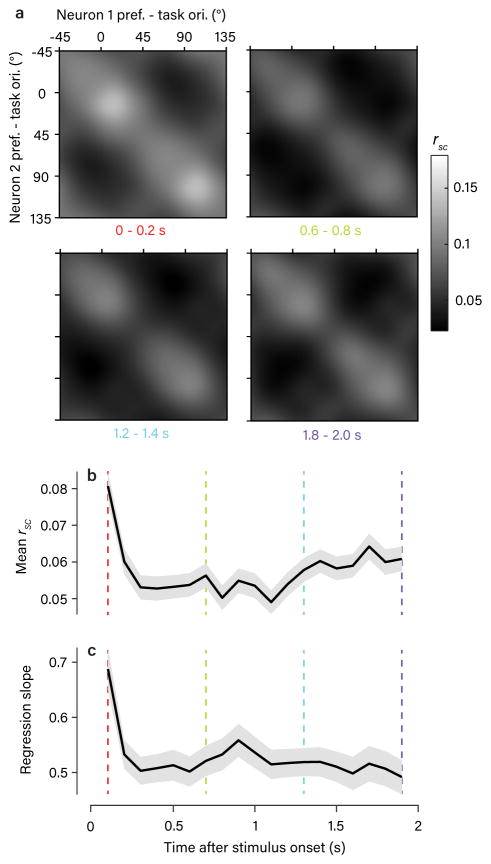
Figure 7. Temporal dynamics of rsc structure.
a. The average, task-aligned rsc matrix (as in Fig. 2e) obtained using spike counts from 200-ms windows during the stimulus presentation. A similar structure was present at all time points (4 examples shown). b–c. Plots showing the temporal dynamics of two statistical measures of the observed rsc structure (mean +/− 1 bootstrap SEM). The colored lines indicate the example time points shown in (a). The population mean rsc value (b) showed a sharp drop shortly after stimulus onset, as seen in other studies50, and then a gradual recovery over the course of the trial. The amplitude of the rsc structure, quantified using the slope of the regression line of rsc obtained in each 200-ms window against rsc obtained from trial-length spike counts, is in (c). Apart from an increase at the first time point, likely due to the onset of the visual stimulus, this showed no significant modulation over the course of the trial. Note that values are all significantly less than 1 because smaller counting windows introduced a source of uncorrelated noise across trials.

