
Figure 5.
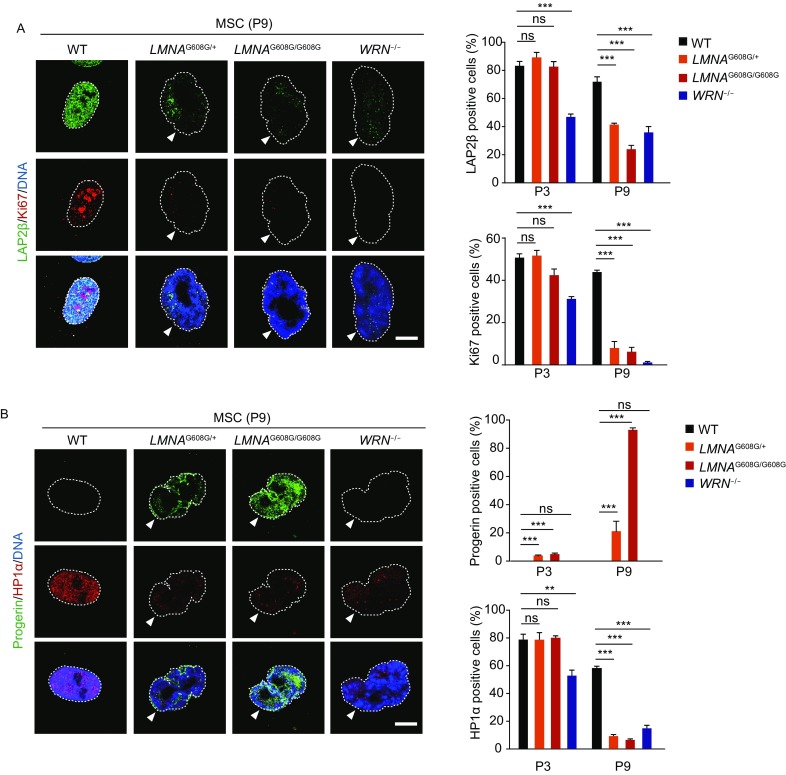
Immunostaining of aging-related markers in HGPS-MSCs and WS-MSCs demonstrates different aging kinetics. (A) Left: representative immunostaining of LAP2β and Ki67 in WT, heterozygous (LMNAG608G/+), homozygous (LMNAG608G/G608G) and WRN−/− MSCs. Dashed lines indicate the nuclear boundaries and white arrows indicate abnormal nuclei. Scale bar, 10 μm. Right: percentages of LAP2β positive cells (upper) and Ki67 positive cells (lower) were shown as mean ± SEM, number of cells ≥ 300. ***P < 0.001; ns, not significant. (B) Left: representative immunostaining of progerin and HP1α in WT, heterozygous (LMNAG608G/+), homozygous (LMNAG608G/G608G) and WRN−/− MSCs. Dashed lines indicate the nuclear boundaries and white arrows indicate abnormal nuclei. Scale bar, 10 μm. Right: percentages of progerin positive cells (upper) and HP1α positive cells (lower) were shown as mean ± SEM, number of cells ≥ 300. ***P < 0.001; **P < 0.01; ns, not significant