
Figure 8.
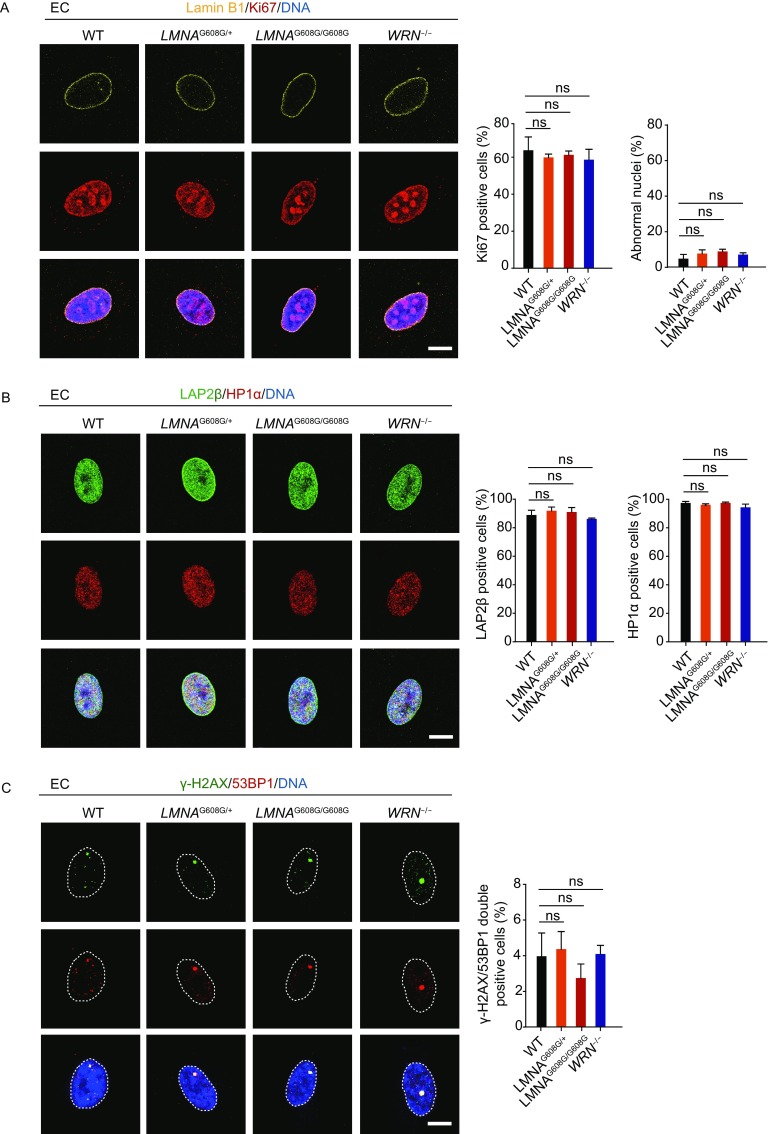
HGPS-ECs and WS-ECs do not exhibit phenotypes of accelerated senescence. (A) Left: representative immunostaining of Lamin B1 and Ki67 in WT, heterozygous (LMNAG608G/+), homozygous (LMNAG608G/G608G) and WRN−/− ECs. Scale bar, 10 μm. Right: percentages of Ki67 positive cells and abnormal nuclei were shown as mean ± SEM, number of cells ≥ 300. ns, not significant. (B) Left: representative immunostaining of LAP2β and HP1α in WT, heterozygous (LMNAG608G/+), homozygous (LMNAG608G/G608G) and WRN−/− ECs. Scale bar, 10 μm. Right: percentages of LAP2β positive cells and HP1α positive cells were shown as mean ± SEM, number of cells ≥ 300. ns, not significant. (C) Left: representative immunostaining of γ-H2AX and 53BP1 in WT, heterozygous (LMNAG608G/+), homozygous (LMNAG608G/G608G) and WRN−/− ECs. Dashed lines indicate the nuclear boundaries. Scale bar, 10 μm. Right: percentages of γ-H2AX/53BP1 double-positive cells were shown as mean ± SEM, number of cells ≥ 300. ns, not significant