
Figure 9.
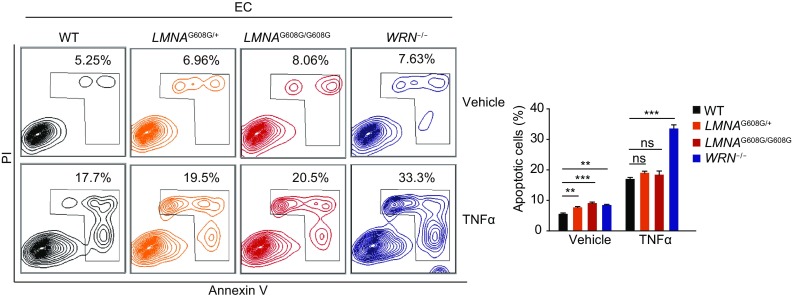
Cellular apoptosis analysis in HGPS-ECs and WS-ECs. Left: cellular apoptosis analysis by FACS after treatment with vehicle or TNFα in WT, heterozygous (LMNAG608G/+), homozygous (LMNAG608G/G608G) and WRN−/− ECs. Right: percentages of apoptotic cells were presented as mean ± SEM, n = 3. ***P < 0.001; **P < 0.01; ns, not significant