Fig. 2.
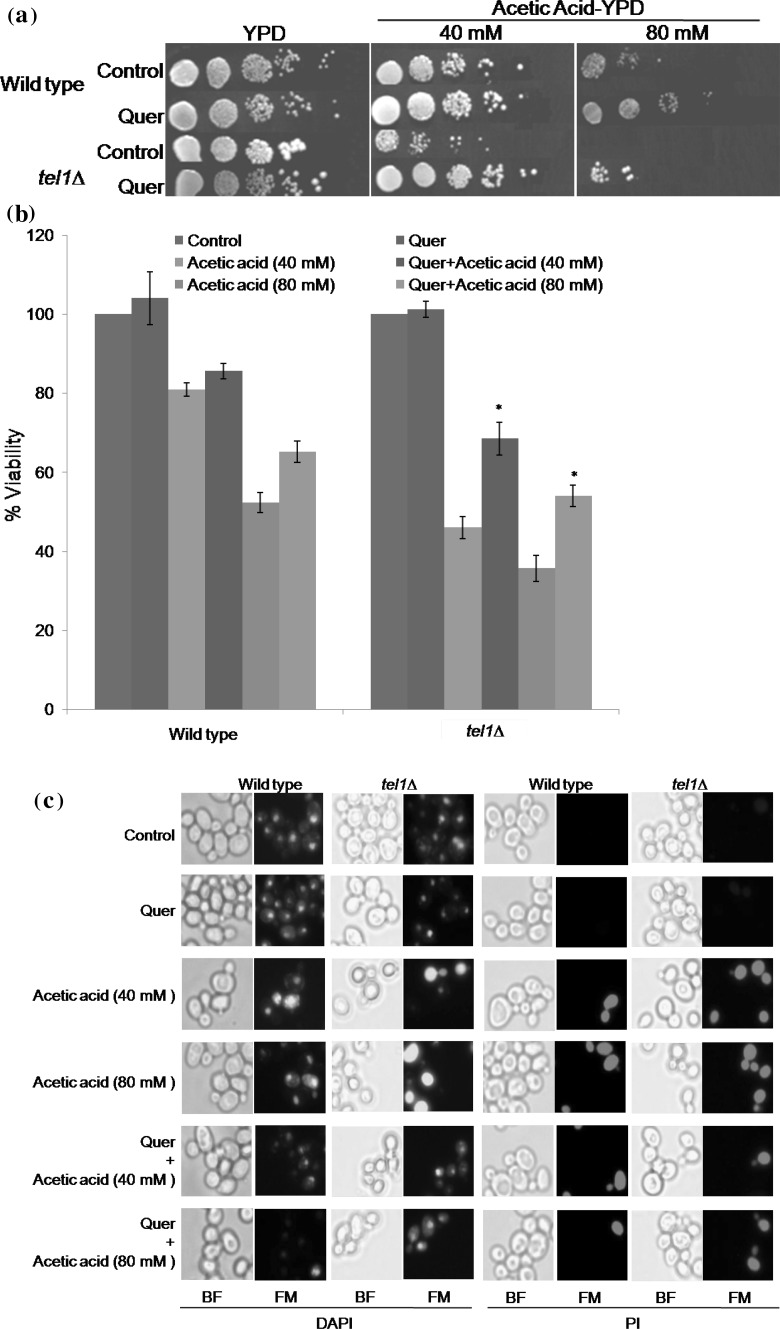
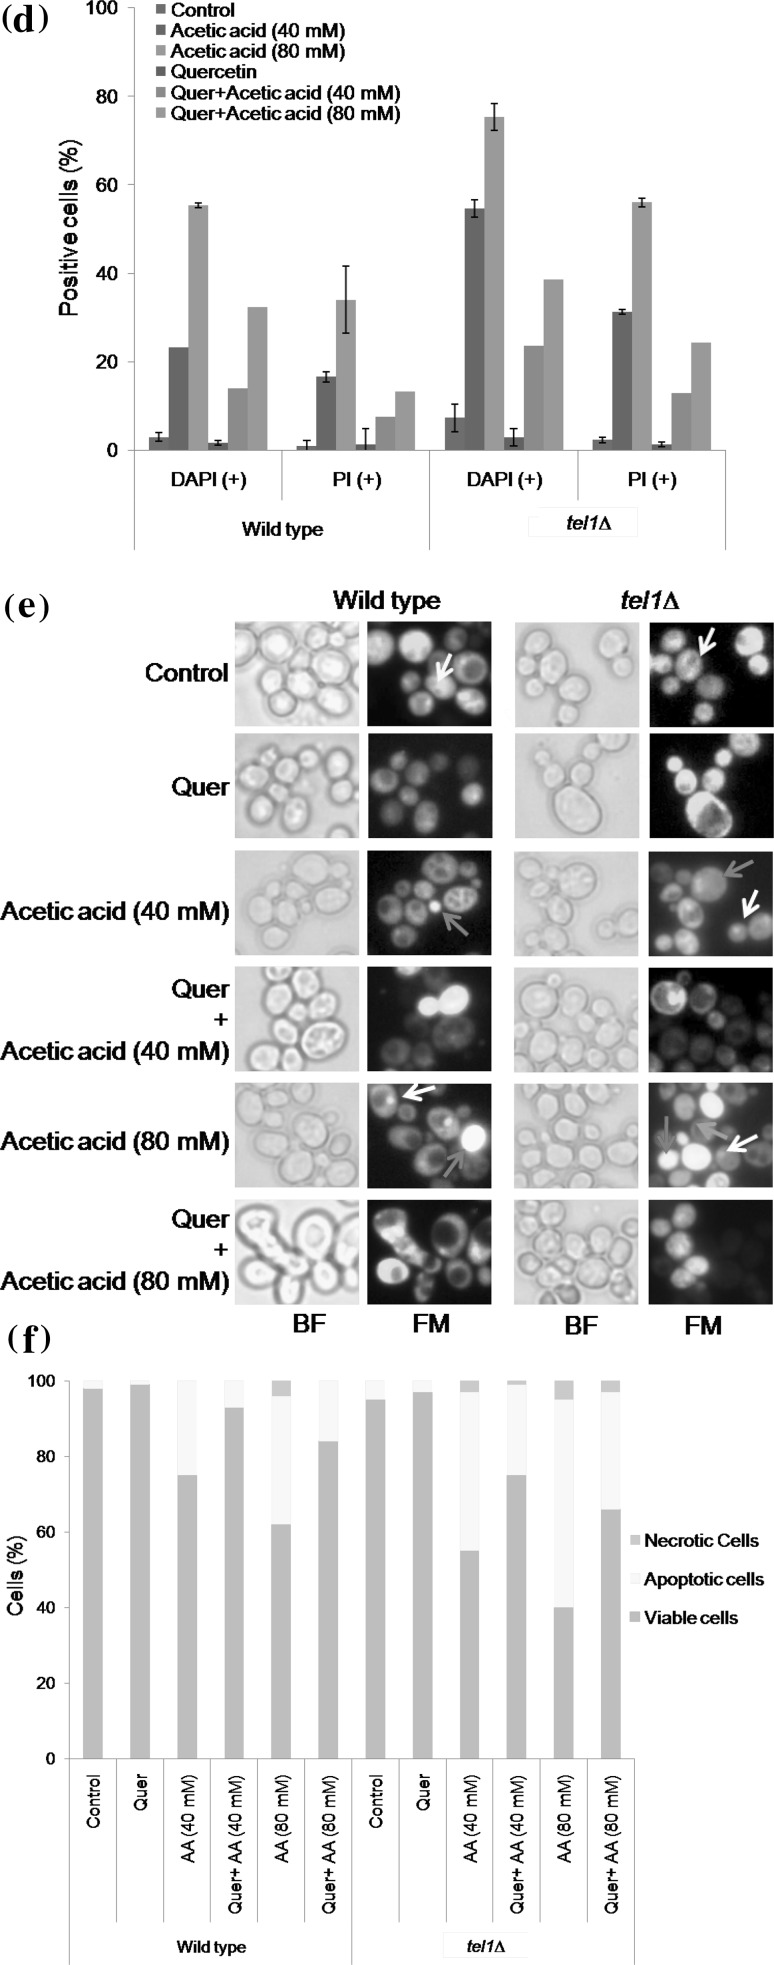
Quercetin protects yeast tel1 mutant cells from acetic acid stress. a Spot assay. Exponentially growing wild type and tel1∆ cells were pretreated with 200 µM quercetin (Quer) or equal volume of DMSO (control) for 1 h. After incubation, cells were tenfold serially diluted and spotted on to YPD plates or YPD plates containing different concentrations of acetic acid (40 and 80 mM). Spotted plates were incubated at 30 °C for 2–3 days. Representative images are shown from at least three independent experiments. b Colony forming unit assay. Viability of wild type and tel1∆ strains was measured after exposure of cells to acetic acid (40 and 80 mM) for 100 min without (control) or with quercetin (200 µM). Values are mean ± SD of three independent experiments (p < 0.05). * represents significant increase in tel1∆ percent viability of Quer + 40 mM acetic acid and Quer + 80 mM acetic acid treatment compared to acetic acid (40 and 80 mM) alone treatment, respectively. Analysis of apoptotic events by fluorescence microscopy c DAPI and PI staining. Exponentially growing yeast cells were treated as described above, stained with DAPI or PI and observed under fluorescence microscope. Representative images are shown from at least three independent experiments. d Percentage DAPI and PI positive cells. A total of 100 cells were examined for DAPI and PI positive cells. Data represent an average of three independent experiments with standard deviation. e Acridine orange/ethidium bromide staining. Exponentially growing yeast cells were treated as described above and stained with AO/EtBr solution. AO/EtBr staining cells shows 3 types of cells: (1) viable cells showed uniform green fluorescence (yellow arrow) with an organized structure and green cytoplasm (2) apoptotic cells exhibited chromatin condensation visible as bright green spot or fragments (white arrow) and yellow fluorescence with condensed or fragmented chromatin (red arrow) (3) necrotic cells stained in orange to red (blue arrow). Representative images are shown from at least three independent experiments. f Percentage of apoptotic cells. For quantitative assessment of AO/EtBr staining, about 150–250 yeast cells were counted per sample in each of three independent experiments. Data represent an average of three independent experiments is shown. BF, bright field; FM, fluorescence microscopy; AA, acetic acid (colour figure online)


