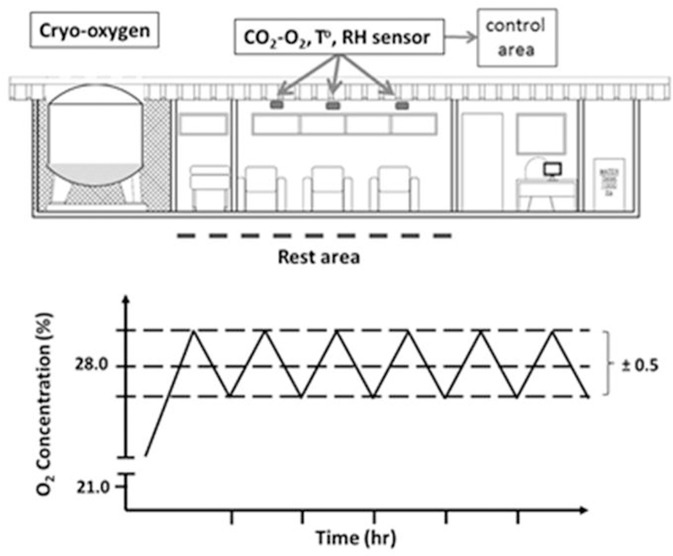
Figure 1.
The scheme represents a diagram of the mobile unit composed of three areas: cryo-oxygen, rest and control area. Control area measured concentration of gases (O2 and CO2), relative humidity (HR), and temperature (°C) and maintained these values at the established requirements. The bottom graph represents the oxygen level control pattern at 5,050 m.

